| Follow @anir0y | |
|---|---|
| The Blue Team Perspective |  |
The Blue Team Perspective sits in the Specialized Domains module of the Jr Penetration Tester path, the same module that holds LLM Pentesting, Cloud Security Fundamentals, and Mobile Application Security. After twelve modules on the attacker’s side, this room flips the chair around: you read a real breach from the SOC, learn a SIEM, and tie every alert back to a framework. The hands-on half runs against a Splunk instance loaded with the BOTSv1 dataset (the Boss of the SOC capture-the-flag data, the imreallynotbatman.com attack against Wayne Enterprises). I drove the Splunk queries through the search REST API from the browser, so every answer below is a real query result, not a guess.
Task 1: Introduction
No answer here, just the framing: seeing a network through the defender’s eyes makes you a sharper attacker, because you learn what trips an alert and what slides past. Click Complete and move on.
Task 2: Inside the SOC, How Defenders Operate
This task is built around the 2013 Target breach. Target’s FireEye sensor fired on the BlackPOS malware, a SOC analyst saw the alert, and nobody escalated it. Eighteen days later 40 million payment cards were gone. The technology worked; the humans did not.
The first question asks which SOC challenge that failure best illustrates. When a detection system does its job and the alert still dies in the queue, the problem is Alert Fatigue: analysts drowning in a stream of alerts stop treating each one as real.
The second question asks for the metric that measures the average time between an attacker’s initial compromise and the organization’s detection of the breach. That is MTTD (Mean Time to Detect). The room also walks through dwell time (Mandiant’s M-Trends puts the global median around two weeks) and MTTR, but the “compromise to detection” definition is MTTD specifically.
Task 3: Your First SIEM, Navigating Splunk
The capability lesson, framed around Equifax: 147 million records lost partly because an expired certificate on a traffic inspection device created a 19-month monitoring blind spot. A SIEM is the single screen that aggregates, normalizes, correlates, alerts, and retains log data so an analyst does not have to log into a dozen systems.
The first question is pure vocabulary: the Splunk field that classifies the format of ingested data and controls how Splunk parses events is sourcetype.
The next two need the lab. The Target URL in the room’s machine panel opens a reverse-proxy Splunk session that is already authenticated, so you land straight on the Search app. Two things matter before any query:
- Set the time range to All time. The BOTSv1 events are backdated, so Splunk’s default Last 24 hours returns nothing and looks like a broken lab. Over the REST API this is
earliest_time=0. - Start broad.
index=botsv1 | stats count by sourcetypetells you what data you actually have.
  # How many distinct sourcetypes are in the dataset
index=botsv1 | stats dc(sourcetype) as distinct_sourcetypes
  #   distinct_sourcetypes
  #   22
The count is 22. One format trap worth noting: the Splunk export endpoint streams a preview result set followed by the final one, so a raw stats count by sourcetype row count can look doubled. A dc() (distinct count) gives the honest number.
The last question asks when the dataset was generated, in Month YYYY format. Pull the event timestamps directly rather than trusting memory:
index=botsv1 | stats earliest(_time) as e latest(_time) as l
| eval generated=strftime(e,"%Y-%m-%d")
  #   generated = 2016-08-24
Every event lands on a single day in August 2016, so the answer is August 2016.
Task 4: Reading the Logs, Attack Patterns in Event Data
The theme is that attacker tooling is loud on the other end: every failed password, every 404, every new service writes a log line. The room cites WannaCry installing its payload as a Windows service (Event ID 7045) as the one event that gave watchers an early warning.
First question: run the FortiGate IPS query and find the source IP with the highest count of IPS-triggered attack signatures.
index=botsv1 sourcetype=fgt_utm subtype=ips
| stats count by srcip | sort -count | head 1
  #   srcip           count
  #   40.80.148.42    4487

One external IP, 40.80.148.42, accounts for 4,487 of the 4,488 IPS hits. That is the attacker.
Second question: find the IP generating more than 100 HTTP 404 responses in the IIS logs.
index=botsv1 sourcetype=iis sc_status=404
| stats count by c_ip | where count > 100 | sort -count
  #   c_ip            count
  #   40.80.148.42    2009
  #   192.168.2.50     110
Two IPs clear 100, but the top talker by far, and the external one doing the enumeration, is 40.80.148.42 again. Same attacker, different log source.
Task 5: When Things Go Wrong, The Incident Response Lifecycle
This task maps to NIST SP 800-61 Rev 2, whose four phases are Preparation, Detection and Analysis, Containment Eradication and Recovery, and Post-Incident Activity.
The first question asks which phase happens before any incident is detected and focuses on building capability through policies, tools, and training. That is Preparation, the only phase that runs entirely before an incident exists.
The second question is about SolarWinds SUNBURST sitting undetected for roughly nine months, and which phase failed during that window. The hint points at the phase responsible for identifying that an incident has occurred: Detection and Analysis. The answer mask here is three words (nine, three, and eight characters), so “Detection and Analysis” is the exact expected phrasing, not “Detection” alone.
Task 6: Know Your Enemy, Threat Intelligence Basics
Two frameworks. MITRE ATT&CK gives a shared vocabulary for adversary behavior, structured as Tactics (the why), Techniques (the what), Sub-techniques, and Procedures.
The first question asks for the third level of specificity below techniques in that hierarchy. Counting from the top (tactics, techniques, then the next refinement) the answer is Sub-techniques, a more specific implementation of a technique (for example T1110.001 Password Guessing under T1110 Brute-Force).
The second question is David Bianco’s Pyramid of Pain: which layer causes the most operational difficulty for an attacker when defenders detect and block it. The top of the pyramid is TTPs. Blocking a hash is free and nearly useless; forcing an adversary to change their tactics, techniques, and procedures is the expensive one.
The third question ties ATT&CK to the data: when you see cmd.exe and powershell.exe spawned by unusual parents in Event ID 4688, which ATT&CK technique covers adversaries executing commands through scripting interpreters. Answer format TXXXX, which is T1059 (Command and Scripting Interpreter).
Task 7: Putting It All Together, The Wayne Corp Investigation
The capstone runs the full chain against the BOTSv1 web attack. First, find the primary external attacker from the Suricata IDS data, excluding private ranges.
The room’s suggested query (NOT src_ip=192.168.* NOT src_ip=10.*) has a trap: the top result by raw Suricata event count is 8.8.8.8, which is just benign DNS traffic, not an attacker. Filter to actual alerts and the picture is clean:
index=botsv1 sourcetype=suricata event_type=alert
NOT src_ip=192.168.* NOT src_ip=10.*
| stats count by src_ip | sort -count
  #   src_ip          count
  #   40.80.148.42    538
  #   85.93.16.47       2

The answer is 40.80.148.42, the same IP the FortiGate and IIS logs already named. The answer mask (__.__.___.__) also rules out 8.8.8.8 and confirms the four-octet 40.80.148.42 shape, a handy sanity check when two IPs compete for the top row.
Second question: using that attacker IP, find the IIS URI path that received the most POST requests.
index=botsv1 sourcetype=iis c_ip=40.80.148.42 cs_method=POST
| stats count by cs_uri_stem | sort -count | head 1
  #   cs_uri_stem                            count
  #   /joomla/index.php/component/search/    14248
  #   /joomla/index.php                        797
  #   /joomla/administrator/index.php           19
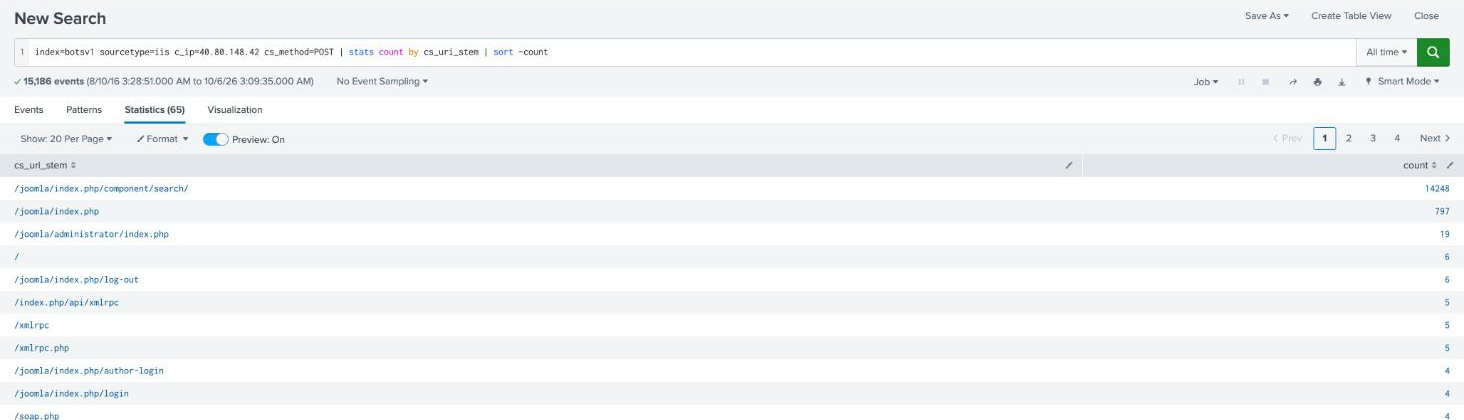
The answer is /joomla/index.php/component/search/. This is worth a second look: the “obvious” brute-force target, /joomla/administrator/index.php, only shows 19 POSTs. The attacker hammered the Joomla search component far harder. By pure volume the search endpoint wins, so follow the data, not the assumption.
Task 8: Conclusion
The conclusion attaches a Companion Ops Console, a static site that runs four judgment exercises (alert triage, mapping the IR lifecycle, ranking indicators on the Pyramid of Pain, and reconstructing the Wayne Corp attack chain). Work through all four and the debrief reveals the flag.
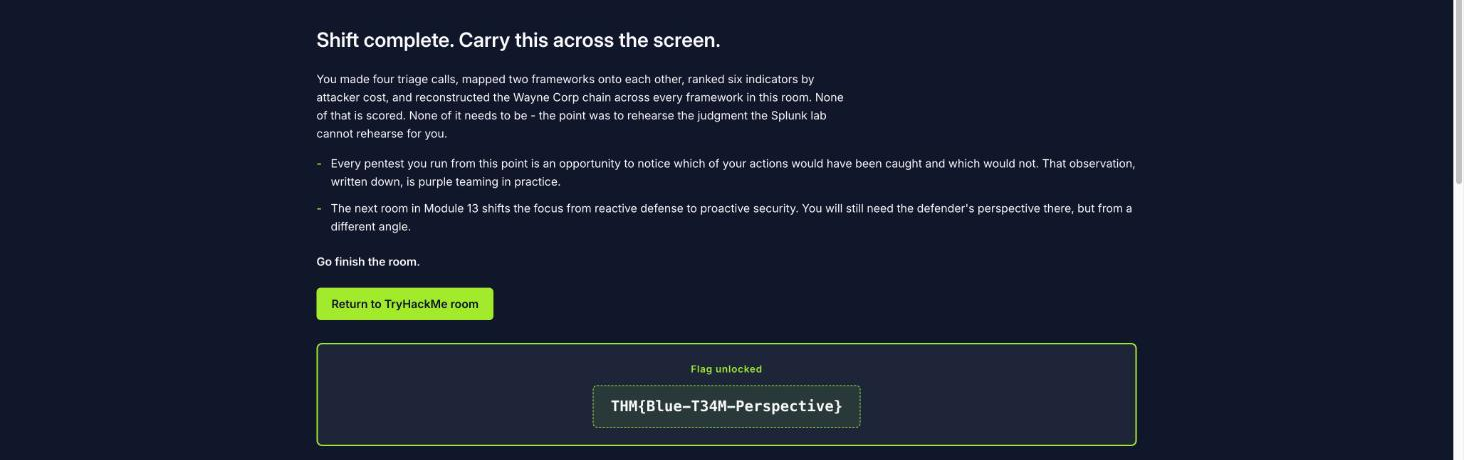
The flag is THM{Blue-T34M-Perspective}.
Takeaways
Two things from this room carry straight into offensive work:
- One attacker, five log sources, one IP. The FortiGate IPS, the IIS 404 counts, and the Suricata alerts all pointed at 40.80.148.42. On a real engagement that convergence is exactly what a SOC uses to pivot from a single alert to the full scope of a compromise, and knowing it tells you which of your own actions will stack up across sensors.
- The time range and the event type decide the answer.
earliest_time=0is the difference between an empty lab and a full dataset, and filtering Suricata toevent_type=alertis the difference between fingering Google DNS and finding the real attacker. In a SIEM, the implicit filter you did not notice is almost always why a confident query returns the wrong row.
Room solved 100%: 8 tasks, 15 answers.