Detecting AD Initial Access
This is the second room in the Active Directory for SOC module, and it picks up exactly where Monitoring Active Directory left off. That room taught you what normal AD noise looks like; this one shows you what the front door looks like when someone kicks it in. Three internet-facing services that all authenticate against the same directory, IIS web applications, Exchange OWA, and a VPN gateway, three different application log sources, and one repeated methodology: the attack shows up in the application log first, and the Windows Security log tells you which account it landed on.
Nine tasks, two separate Splunk instances (Tasks 2-7 use one, the Task 8 challenge gets its own with completely different data), and every answer is a query away. As in the previous room I drove Splunk through its REST API rather than the UI, then re-ran the interesting searches in the browser for the screenshots below. All nine tasks solved, 144 points.

Two setup notes that will save you time. Both instances put IIS access logs in index=iis and Windows Security plus Sysmon in index=win. And the data is timestamped February 2026, so set the time picker to All time, the room says this explicitly for Task 8 and it applies to every task. A default Last 24 hours search returns nothing and looks like a broken lab.
Task 2: IIS log fields worth caring about
The graded answer is the default IIS log location, C:\inetpub\logs\LogFiles\W3SVC1. One line per HTTP request, and the fields that matter for an investigation are c-ip (source), cs-uri-stem (path), cs-uri-query (query string, which is where web shell commands live), cs-method, sc-status, and the user agent.
The detail that bites people during correlation: IIS writes every timestamp in UTC regardless of the server’s local time zone, while Windows Security events use local time. If your IIS and Security timelines are offset by a fixed number of hours, that’s why.
Task 3: hunting the web shell
A web shell is an .aspx script that turns HTTP requests into OS commands. The room’s framing is HAFNIUM/ProxyLogon in March 2021, four Exchange zero-days chained to drop China Chopper shells into C:\inetpub\wwwroot\aspnet_client\ across tens of thousands of servers, and CISA reporting the same .aspx pattern on US government IIS servers via a Telerik bug in 2023. Different vulnerability, identical detection.
The investigation starts with scanning noise. A burst of 404s from one source is a directory scanner:
index=iis sc_status=404 | stats count by c_ip | sort -count
#   203.0.113.47   114
One IP, 114 misses. Filtering that IP’s successes surfaces what it found, and one of the hits does not belong:
index=iis c_ip=203.0.113.47 sc_status=200 | stats count by cs_uri_stem | sort -count
#   /aspnet_client/system_web/shell.aspx   6
So the web shell is shell.aspx and the interacting IP is 203.0.113.47. The location is the tell: /aspnet_client/ is a stock IIS directory for client-side scripts that should never contain application code, and it happens to be writable by the worker process. Same folder HAFNIUM used.
Pulling the shell’s query strings shows the commands, but on this dataset all six IIS entries carry the same second (10:44:15), so IIS alone cannot order them. That is what the Sysmon process chain is for, and it is the real lesson of the task. During normal operation w3wp.exe serves HTTP and spawns nothing; when a web shell runs, it spawns shells:
index=win EventCode=1 ParentImage="*\\w3wp.exe" | table _time, ParentImage, CommandLine | sort _time
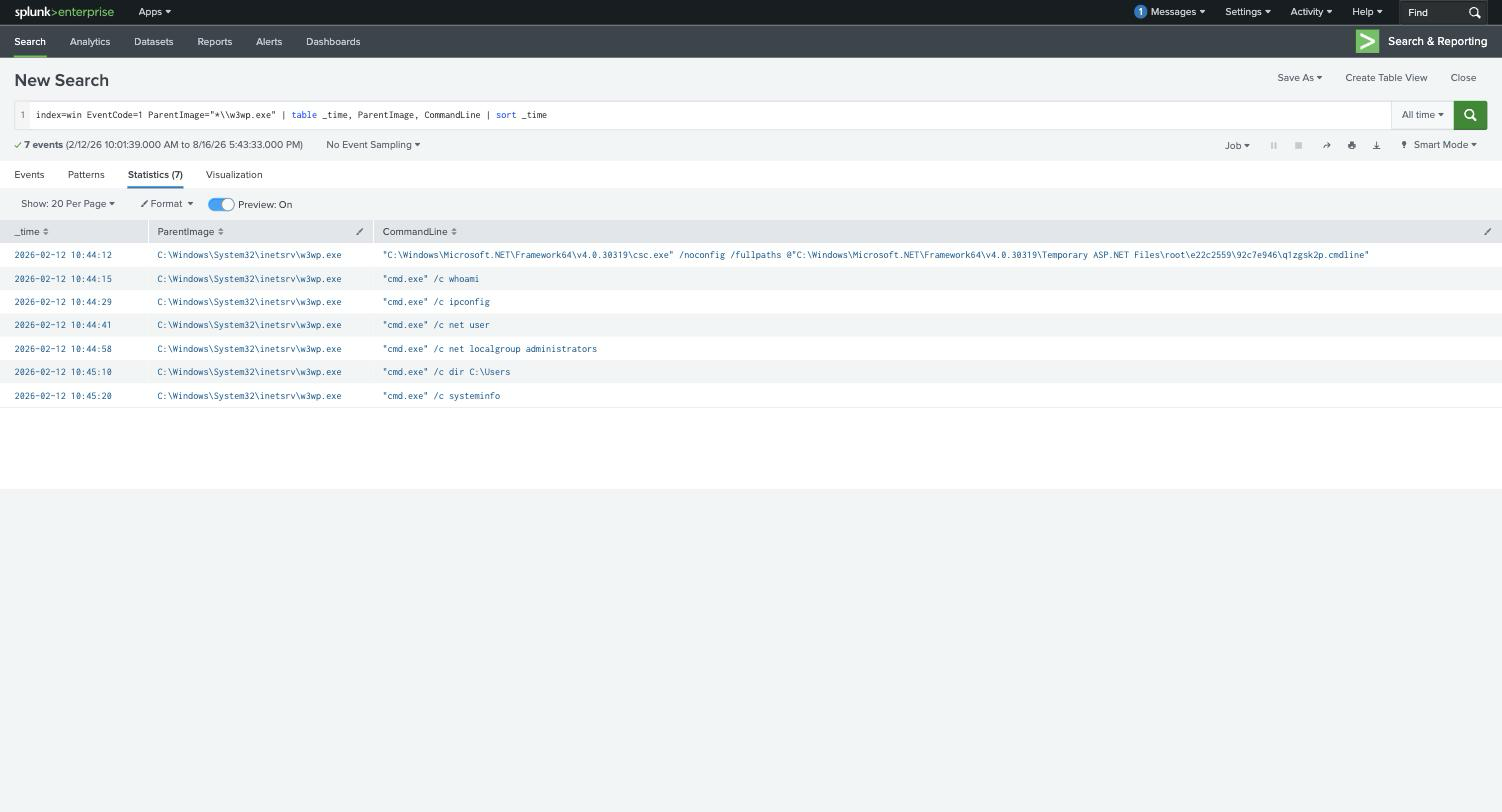
Now the ordering is unambiguous, with real gaps between commands: whoami at 10:44:15, then ipconfig, net user, net localgroup administrators, dir C:\Users, and systeminfo. The first reconnaissance command is whoami, the answer you cannot safely read off the IIS log.
Note the first row: csc.exe, the C# compiler, at 10:44:12. That is not malicious. ASP.NET compiles .aspx pages on first request, so w3wp.exe → csc.exe is expected and is exactly the false positive the room warns about. The distinguishing factor is never the parent-child pair on its own, it is what gets executed, cmd.exe /c whoami is not a compilation step.
Task 4: reading OWA from logs
Terminology first, because the room grades on it: Exchange is the server, Outlook is the desktop client, and OWA is the browser interface running on IIS.
The awkward part of OWA analysis is that both successful and failed logins return HTTP 302, success redirects to the inbox, failure redirects back to the login page with reason=2 in the query string. The status code alone tells you nothing, and cs_username is typically empty for OWA. So IIS gives you the attacker’s IP but never the targeted account, and you pivot to Windows Security 4625 to get the username. The Exchange admin console lives at /ecp, and access to it should be rare enough to alert on.
Task 5: the OWA brute-force
Microsoft’s own January 2024 Midnight Blizzard disclosure is the case study, password spraying against Microsoft’s corporate Exchange, landing on a legacy test account with no MFA, then reading senior leadership email.
The IIS signal is a pile of POSTs to the auth endpoint from one address:
index=iis cs_uri_stem="/owa/auth.owa" cs_method=POST | stats count by c_ip | sort -count
#   203.0.113.47   16     <- same IP as the web shell
#   10.5.50.10/12/15/20     1 each (normal users)
Then Security 4625 names the victim:
index=win EventCode=4625 | stats count by user, Logon_Type | sort -count
#   sarah.kim     Logon_Type 8   15
#   david.chen    Logon_Type 3   10
Logon_Type 8 is NetworkCleartext, which is how IIS-hosted apps authenticate against AD, a useful fingerprint on its own. Because the failures pile onto one account rather than spreading across many, this is brute force rather than spraying; at the IIS layer those two look identical, and only 4625 separates them.
The correlation query makes the outcome obvious:
index=win EventCode IN (4624,4625) user="sarah.kim" Logon_Type=8
| table _time, EventCode, user, Process_Name, Logon_Type | sort _time
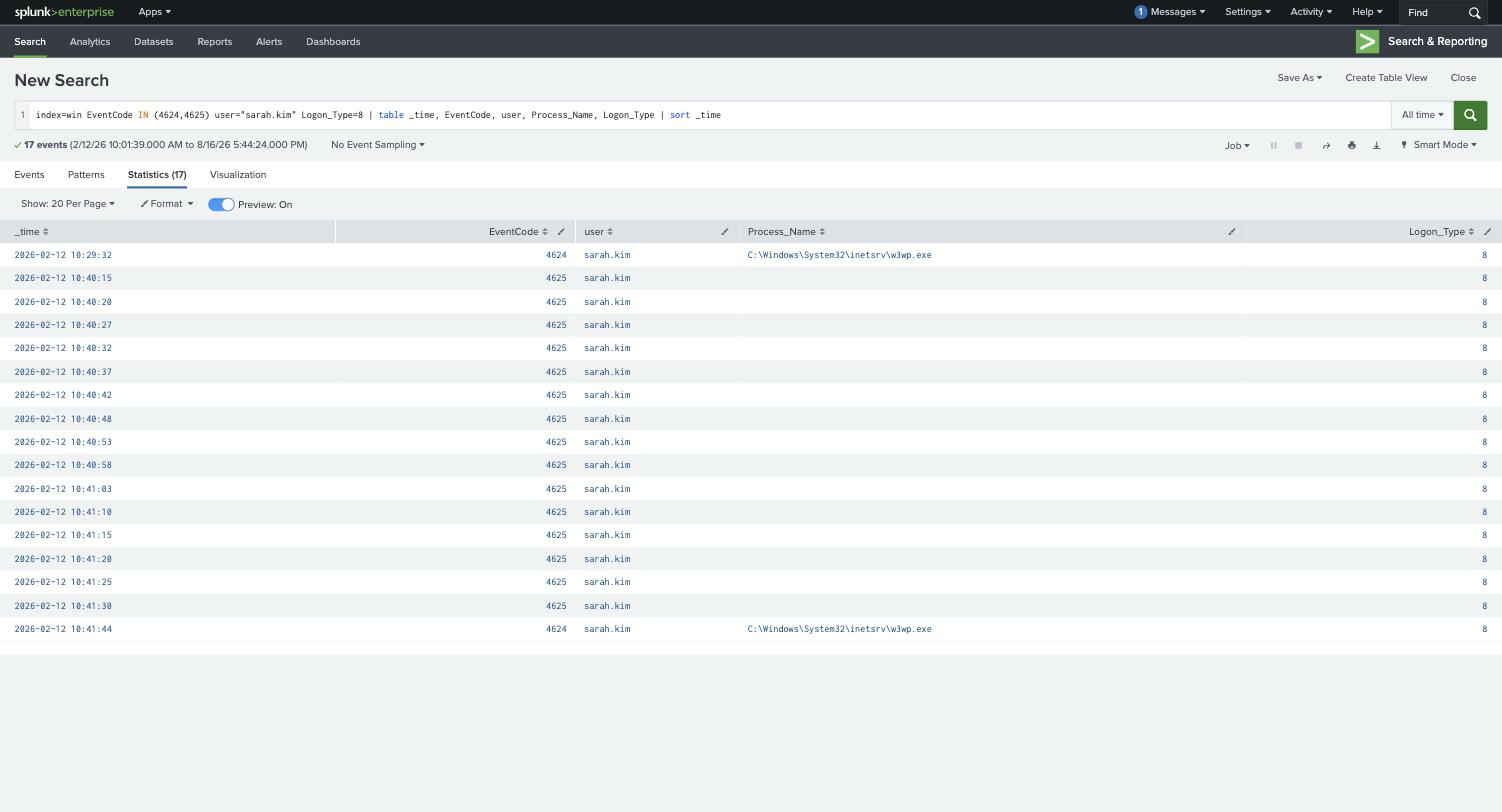
15 failures marching from 10:40:15 to 10:41:30 at roughly five-second intervals, then a 4624 success at 10:41:44. The compromised account is sarah.kim, the source is 203.0.113.47, and Process_Name on both bookend events is w3wp.exe, confirming IIS handled the authentication locally.
That 4624 at the top of the table at 10:29:32 is sarah.kim’s own legitimate login eleven minutes before the attack, worth noticing so you don’t mistake it for the compromise.
Post-authentication, the attacker went where you’d expect:
index=iis c_ip="203.0.113.47" cs_uri_stem="/ecp*" | table _time, cs_uri_stem, sc_status
#   10:44:15   /ecp/   200
/ecp, the Exchange admin console, reached three minutes after the successful login. From there an attacker can create forwarding rules or export mailboxes, so this is the escalation point.
The warning the room attaches here is important: Source_Network_Address in these 4624/4625 events is empty or local, because IIS processes the logon on the web server itself. The attacker’s real IP exists only in the IIS log. Neither source is sufficient alone.
Tasks 6 and 7: VPN via NPS
VPN gateways are usually non-Windows appliances, so they speak RADIUS to a Windows Network Policy Server, and NPS is what writes events. 6272 is access granted, 6273 is denied, 6274 is discarded. On 6273 the Reason Code matters: 16 is a bad username or password (a credential attack), while 48 (no matching network policy) and 65 (shared secret mismatch) are misconfigurations, not attacks. Mixing those up is how a broken RADIUS config becomes an incident ticket.
index=win EventCode=6273 | stats count by User_Account_Name, Client_IP_Address | sort -count
#   david.chen       10.5.10.200   10
#   liam.patel       10.5.10.200    1
#   michelle.smith   10.5.10.200    1

index=win EventCode=6272 | eval t=strftime(_time,"%T") | table t, User_Account_Name
#   10:47:06   david.chen
Ten denials against david.chen, then a single grant. The compromised account is david.chen and the successful VPN authentication occurred at 10:47:06. Client_IP_Address here is 10.5.10.200, which is the VPN gateway forwarding the RADIUS request, not the attacker, a distinction worth internalising before you block the wrong address.
The room’s closing point on VPN is the sharpest idea in it: if the attacker already bought working credentials from an access broker, there is no failure cluster at all. You get one clean 6272 that is indistinguishable from a legitimate login, and detection falls entirely to post-authentication behaviour. Akira’s ransomware operations are the cited example, sometimes exfiltrating within two hours of initial access.
Task 8: the investigation challenge
A fresh Splunk instance with different data. The alert: unusual volume of 404s from a single external IP. Same methodology, new answers, and this one is a better puzzle than the walkthrough because the attacker tried to blend in.
index=iis sc_status=404 | stats count by c_ip | sort -count
#   198.51.100.23   21
Filter that IP’s successes and the shell is hiding in plain sight at /aspnet_client/system_web/error.aspx, named to look like a stock ASP.NET error page rather than the obvious shell.aspx of the walkthrough. The web shell is error.aspx.
The process chain gives the command ordering again:
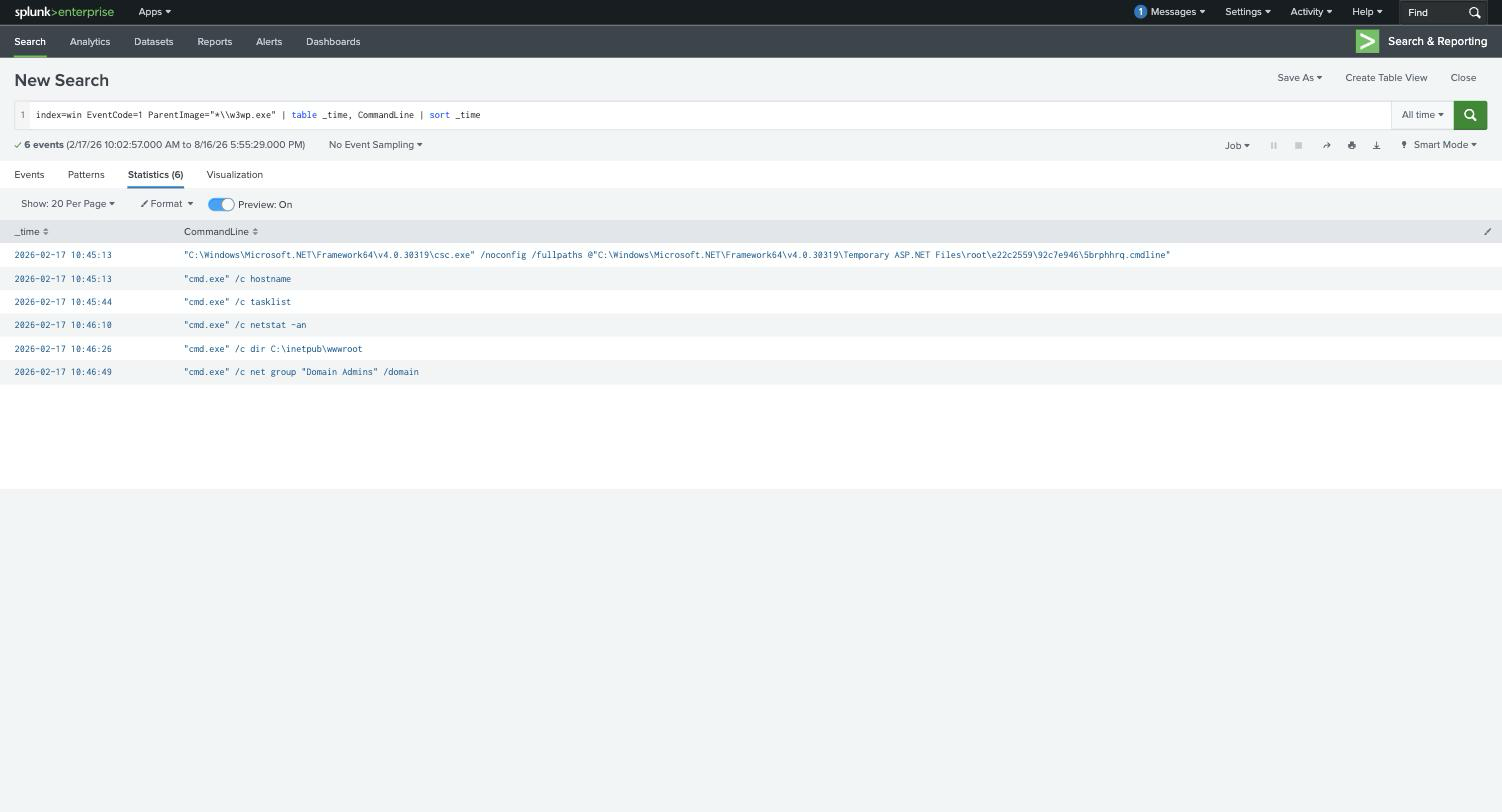
First reconnaissance command is hostname, followed by tasklist, netstat -an, dir C:\inetpub\wwwroot, and finally net group "Domain Admins" /domain, the last one being the moment this stops being a web server problem and becomes an AD problem. And again csc.exe sits at the top of the list as benign compilation noise.
For the last two answers, the upload and the drop are two views of the same instant:
index=* (cs_method=POST AND cs_uri_query="*error.aspx*") OR (EventCode=11 AND TargetFilename="*wwwroot*error.aspx")
| eval evidence=coalesce(cs_uri_stem,"Sysmon EID 11 FileCreate"), detail=coalesce(cs_uri_query,TargetFilename)
| table _time, index, evidence, detail | sort _time
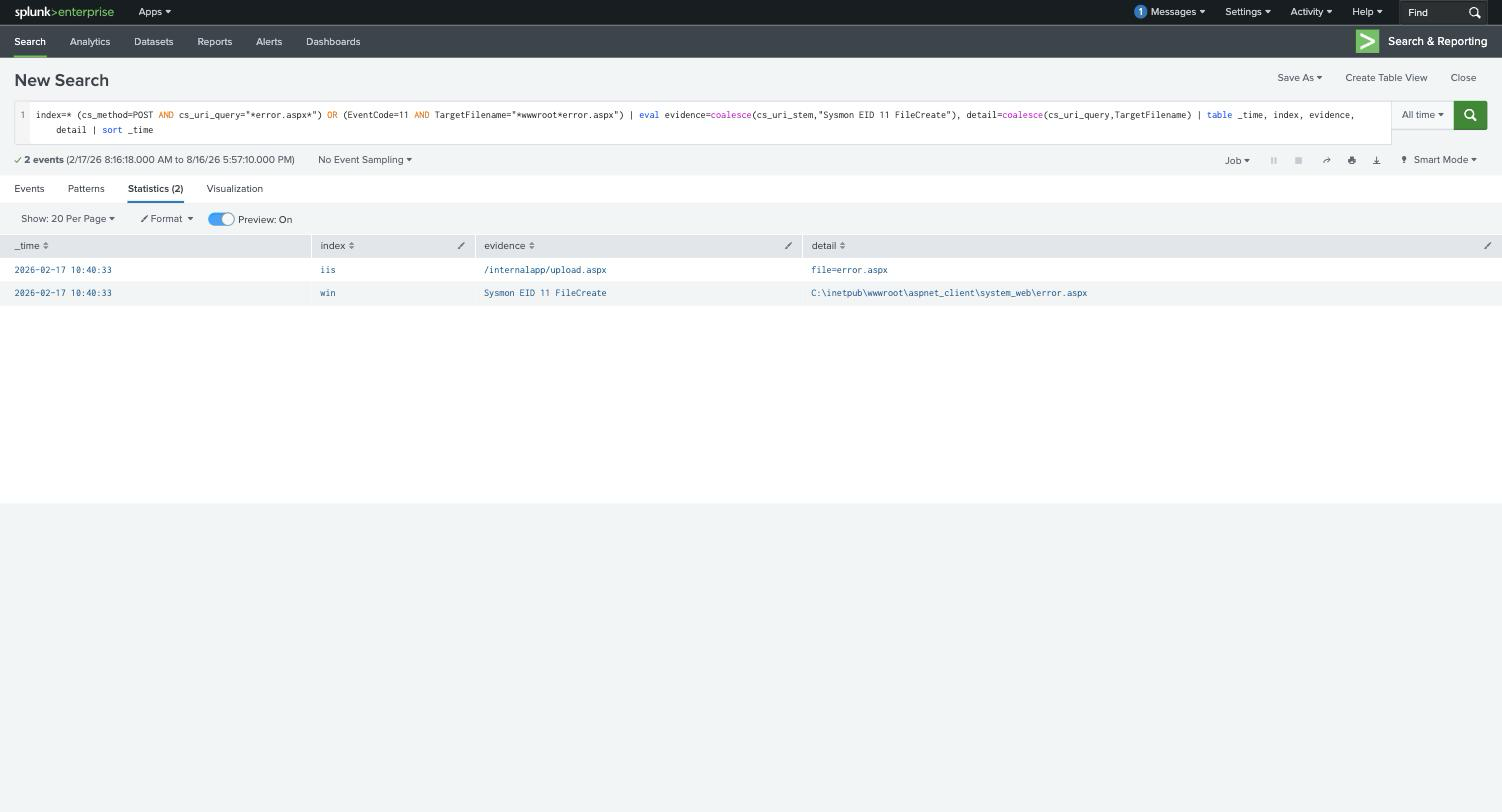
Both rows land on 10:40:33. The IIS side shows a POST to /internalapp/upload.aspx with file=error.aspx, and the Sysmon side shows w3wp.exe creating C:\inetpub\wwwroot\aspnet_client\system_web\error.aspx. So the upload path is /internalapp/upload.aspx and the file was created at 10:40:33.
That single query is the whole room in miniature: the application log tells you how it got there, the endpoint log tells you what landed on disk, and the matching timestamp is what turns two coincidences into one finding. Also worth noting is the five-minute gap, dropped at 10:40:33, first command at 10:45:13, which is a normal amount of time for an operator to switch tools.
Task 9: what transfers
The methodology is genuinely portable, and that is the point of running three scenarios instead of one. IIS, Exchange, and NPS are different log formats describing the same shape of event: a burst of failures from one source, then one success, then activity that does not fit the account. The w3wp.exe spawning a shell pattern catches web shell interaction no matter which vulnerability got the file there, which is why it survives new CVEs.
Two things I would keep on a cheat card. Logon Type 8 means the authentication came through an IIS-hosted app, so an unexplained Type 8 on a web server is worth a look on its own. And application logs and Security logs are each incomplete, IIS has the attacker’s real IP but not the username, 4625 has the username but not the IP. Any investigation that uses only one of them reaches a confident wrong conclusion.
Room solved 100%: nine tasks, 144 points.