
Elastic: Setting up a SOC Lab
This is a hands-on room in the Advanced Elastic module. Over eight tasks you stand up a small Security Operations Center on a single Linux host: install Elasticsearch and Kibana, enrol a Fleet Server and Elastic Agent, ingest native Linux logs, add Apache web logs, onboard a custom VPN log source through a Grok ingest pipeline, and finish with dashboards and visualizations. It is a genuinely useful build because it walks through the same moving parts you would wire together in a real deployment, just scaled down to one machine.
The walkthrough itself is well written and the GUI steps are straightforward to follow, so rather than re-narrate every click, this post focuses on what each task is actually asking and how to answer it. A theme worth calling out up front: most of the “look in Discover” and “build this visualization” questions are really questions about the underlying data, and that data lives in plain files on the box. Where the room wants a percentage or a specific value, the fastest and most reliable way to get an exact answer is to read the log file directly in the terminal. I solved the data questions that way and let the grader confirm each one.

Task 2: the Elastic Stack, four moving parts
Before touching the install, the room lays out the architecture. Four components matter:
- Elasticsearch is the search engine and data store. It indexes logs and answers queries on TCP 9200.
- Kibana is the web interface analysts use to search, build dashboards, and investigate. It runs on 5601 and holds no data of its own, talking to Elasticsearch to fetch it.
- Elastic Agent is the lightweight service installed on hosts to collect and forward data. It replaces the older individual Beats and only makes outbound connections.
- Fleet Server is the central manager for agents, reached through Kibana, commonly on port 8220.
Both questions come straight from those descriptions. The interface analysts use to visualize log data is Kibana, and the component you use to manage agents across a client’s infrastructure is the Fleet Server.
Task 3: installing Elasticsearch and Kibana
The installers are pre-staged in /home/ubuntu/Downloads/elastic, so the install is a couple of dpkg -i commands as root. The one thing to actually write down is the generated elastic superuser password that Elasticsearch prints during install, because you need it to log in to Kibana later. The room also has you cap the JVM heap at 1g and drop two settings into kibana.yml (an encryption key and a Fleet registry URL) so Fleet works in the next task, then start and enable both services.
Kibana binds to localhost on port 5601, which is the first answer. Getting into the UI is the usual enrollment dance: generate an enrollment token and a verification code from the terminal, paste them into the browser, then log in as elastic. Once you are on the Kibana home page and open the main menu in the top left, the first section listed is Analytics (the group that holds Discover, Dashboards, and the rest). The room’s own “Welcome home” screenshot gives it away too, with the Elasticsearch, Observability, Security, and Analytics cards.
Task 4: Fleet Server, the Elastic Agent, and system logs
Installing Fleet Server is done from Kibana: you fill in the server name and the host URL (https://MACHINE_IP:8220), generate a policy, then run the produced ./elastic-agent install ... command on the box with --insecure added, since the lab uses self-signed certificates. Installing Fleet Server also installs an Elastic Agent on the same host, which immediately starts shipping data through the default System integration. That is the first answer: the System integration is what collects host metrics and logs.
The next two questions have you generate events and find them in Discover. Both are just entries in /var/log/auth.log, so you can create the events and read the exact log lines in one place:
useradd testuser
gpasswd -a testuser sudo
grep -E 'useradd|gpasswd' /var/log/auth.log | tail
# ... soclabelastic useradd[3040]: new user: name=testuser, UID=1001...
# ... soclabelastic gpasswd[3048]: user testuser added by root to group sudo
The useradd events are parsed by the System integration into the event.dataset value system.auth. And the full message field for the gpasswd event is exactly what the log line carries: user testuser added by root to group sudo.
Task 5: Apache web logs and the hidden flag
Task 5 introduces “TryHatMe,” a boutique shop served by Apache on port 8080, and has you add the Apache HTTP Server integration so its access and error logs flow into Elastic. The access logs land under the event.dataset value apache.access.
The flag question is the fun one. The room says to browse to /secret.html and inspect the user_agent.original field of the recent requests. Pulling the page source in the terminal explains why:
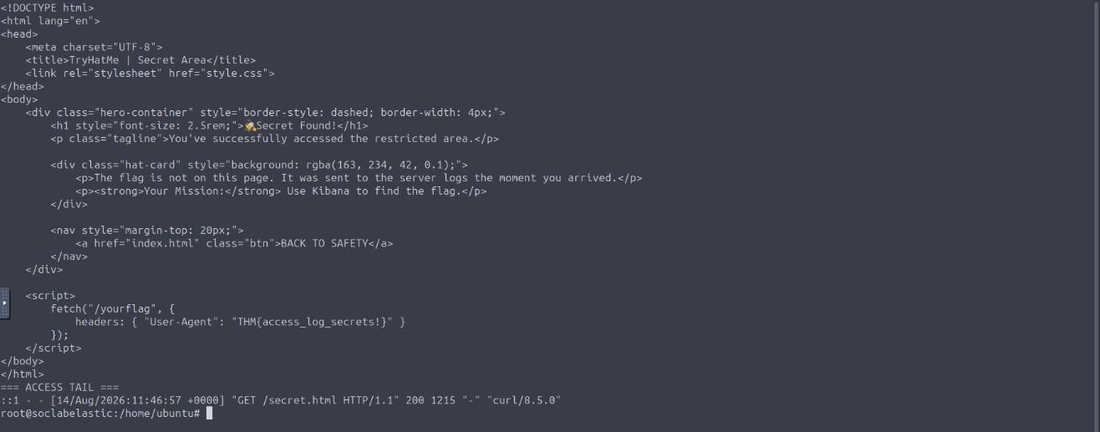
The page tells you plainly that “the flag is not on this page, it was sent to the server logs the moment you arrived,” and the script at the bottom is the mechanism: loading /secret.html fires a request to /yourflag with the User-Agent set to the flag. That request is what shows up in the access log’s user_agent.original field. The flag is THM{access_log_secrets!}.
Task 6: a custom VPN log source
This is the most instructive task. Real environments have proprietary logs that no pre-built integration understands, so the room walks through handling one. A script generates 500 lines of custom VPN logs at /var/log/vpnlog, each line being a timestamp, an action, a user, a source IP, a client IP, and a server region. Because Elastic has no parser for this format, you build a Grok ingest pipeline to extract those six fields, add a Date processor to map the timestamp, then ship the file with the Custom Logs (Filestream) integration pointed at your pipeline.
That is the correct way to get the data into Kibana. But the two questions, the most active user and their source IP, are simply aggregations over that flat file, and the generated data is deterministic (the room’s own “234 records” figure matches every run). So a couple of awk one-liners answer them exactly:
python3 /home/ubuntu/Downloads/scripts/vpnlog.py      # writes 500 lines to /var/log/vpnlog
awk '{print $3}' /var/log/vpnlog | sort | uniq -c | sort -rn | head
#      89 s.summer      <- most active user
awk '$3=="s.summer"{print $4}' /var/log/vpnlog | sort | uniq -c
#      89 72.14.24.1    <- their source.ip
The most active user on the network is s.summer with 89 events, and every one of those came from the source IP 72.14.24.1.
Task 7: dashboards and visualizations
The final task builds a dashboard from the saved VPN search and layers pie and line charts on top. It is good practice with Kibana’s visualization builder, and the questions map cleanly onto the same field aggregations:
# auth_fail events, broken down by user
awk '$2=="auth_fail"' /var/log/vpnlog | wc -l                 # 40 total
awk '$2=="auth_fail"{print $3}' /var/log/vpnlog | sort | uniq -c | sort -rn
#      25 p.mallow   ->  25/40 = 62.5%
# region totals (least accessed)
awk '{print $6}' /var/log/vpnlog | sort | uniq -c | sort -n | head -1
#      86 us-west-1
# client IP seen exactly 26 times
awk '{print $5}' /var/log/vpnlog | sort | uniq -c | awk '$1==26'
#      26 10.10.10.116
The user p.mallow accounts for 25 of the 40 auth_fail events, which is 62.5%. The least accessed vpn.server.region is us-west-1 at 86 hits (well behind uk-london’s 271). And the vpn.client.ip logged exactly 26 times is 10.10.10.116.
Solving from the log files
None of the above skips the point of the room. Building the pipeline, the integrations, and the dashboards is the skill the room is teaching, and it is worth doing at least once to see how Fleet, ingest pipelines, and Discover fit together. But when a question asks for a precise count or percentage, reading the source file with awk is exact and immediate, where eyeballing a pie chart slice is neither. It is also how a real analyst sanity-checks a dashboard: the visualization and the raw log should agree, and if they do not, the parsing is wrong. Every value derived this way was confirmed by the room’s grader.
Every answer
| Task | Question | Answer |
|---|---|---|
| 2 | Interface analysts use to visualize log data | Kibana |
| 2 | Component used to manage deployed agents | Fleet Server |
| 3 | Default Kibana port | 5601 |
| 3 | First section listed in the Kibana menu | Analytics |
| 4 | Default integration for host metrics and logs | System |
| 4 | event.dataset for the useradd logs | system.auth |
| 4 | Full message for the gpasswd event | user testuser added by root to group sudo |
| 5 | event.dataset for Apache access logs | apache.access |
| 5 | Hidden flag in user_agent.original | THM{access_log_secrets!} |
| 6 | Most active user on the network | s.summer |
| 6 | source.ip of that user | 72.14.24.1 |
| 7 | Percent of auth_fail events from p.mallow | 62.5% |
| 7 | Least accessed vpn.server.region | us-west-1 |
| 7 | vpn.client.ip logged exactly 26 times | 10.10.10.116 |
Wrap-up
Elastic: Setting up a SOC Lab is a solid end-to-end build. By the last task you have installed the stack, enrolled an agent through Fleet, ingested three very different log sources (native Linux, Apache, and a custom VPN format), and turned raw events into a dashboard. The custom-log task is the one to slow down on, because writing a Grok pipeline to structure an unknown log format is a skill that carries directly into real detection engineering. And the running theme is a good habit to keep: the dashboard is a convenient view, but the answer always lives in the data, so when you need to be exact, go read the log.