Monitoring Active Directory
This is the first room in the Active Directory for SOC module of the SOC Level 2 path, and it is the defender’s half of AD. Instead of attacking the domain, you learn what normal AD noise looks like, which Event IDs describe which action, and how to pull a single user’s story out of a dataset where computer accounts generate most of the traffic. Eight tasks, a Splunk instance loaded with a win index, and one practical investigation at the end.
The room is happy for you to click around Splunk’s UI, and that works fine. But every answer here is a single stats or table away, and Splunk Web proxies splunkd, so the fastest path is to fire the SPL directly and read the values back. That is the approach below, and the grader accepted every answer, all eight tasks, 104 points.

The lab machine takes the advertised 4-5 minutes. Once it is up, the Splunk URL from Task 1 drops you straight into Search & Reporting already authenticated (Splunk 9.4.7), and the whole dataset lives in one index:
index=* | stats count by index
#   -> win   9900
That is the entire corpus: 9,900 events in index=win. Worth knowing up front, because several questions say “across all time” and Splunk’s default time picker is Last 24 hours, the data is timestamped February 2026, so a default-range search returns nothing. Set the picker to All time (or earliest=0) before anything else. That single detail is where most people lose ten minutes in this room.
Task 2: the protocols that generate AD traffic
No graded answer, but the table is the mental model for everything that follows. AD activity rides on Kerberos (88), LDAP (389/636 and the global catalog on 3268/3269), SMB (445, with 139 for legacy NetBIOS sessions), RDP (3389), and the legacy name-resolution fallbacks NetBIOS (137/138) and LLMNR (5355). Each of those leaves a different trail, and knowing which protocol produced an event tells you which log to go read.
The task opens with the May 2024 Black Basta intrusion at Ascension Healthcare, Kerberoasting weak service account passwords into privileged domain credentials, 5.6 million patient records exposed. It is a good framing: the attack was entirely ordinary AD protocol usage, which is exactly why monitoring rather than blocking is the control that catches it.
Task 3: authentication events
The important distinction in this task is where authentication is logged, and it turns on where the credentials live.
Domain users authenticate against the Domain Controller, and their credentials are stored in the AD database, NTDS.dit. Local users authenticate against the local SAM database on the machine itself, and the DC is never involved. So when the room asks whether a local user authenticating to a workstation generates any events on the Domain Controller, the answer is Nay: those events exist only in that workstation’s Security log. This is the reason DC logs give you a centralized, cross-system view of domain activity but a blind spot for local accounts.
The Kerberos flow is three events across two hosts. A user requests a TGT, Event 4768, logged on the DC. They then request a service ticket, 4769, also on the DC. Finally a session is created on the target, 4624, logged on that target server. A failed pre-authentication (wrong password) produces 4771 on the DC. NTLM, when Kerberos is unavailable, shows up as 4776 on the DC plus 4624 on the target.
The graded question is a distinct count of TGT requesters:
index=win EventCode=4768 | stats dc(Account_Name) as unique_accounts
#   -> 14
14 unique accounts requested TGTs across the dataset. Note that this count includes computer accounts, it is deliberately the unfiltered number, which sets up the point Task 5 makes.
Task 4: accounts, groups, and resource access
This task covers the account lifecycle (4720 created, 4722 enabled, 4724 password reset, 4725 disabled, 4740 locked out), group membership changes (4728 global, 4732 domain local, 4756 universal), directory-service attribute changes (5136), and logon success/failure (4624/4625).
The field question is a matter of reading the group-change events: in Splunk the group a member was added to is carried in Group_Name, alongside Member_Account_Name for who was added and Subject_Account_Name for who made the change.
The second question wants the dominant logon type:
index=win EventCode=4624 | stats count by Logon_Type | sort -count
#   Logon_Type  count
#   3           497
#   5            81
#   2             8
#   10            4
#   7             4
Type 3 (Network) dominates at 497 of 594 logons, which is exactly the expected shape, file share access, WMI, and remote administration generate volume, while Type 2 (interactive at the keyboard) and Type 10 (RDP) represent actual human sessions and stay small. If that ratio ever inverts on a server, something is wrong.
One nuance worth flagging on 5136: it captures changes to a GPO’s metadata in AD, the displayName, the versionNumber incrementing, the gPCFileSysPath, but not the policy settings inside the GPO, which live in SYSVOL files and need separate monitoring. So 5136 tells you a GPO was touched and by whom, not what was changed within it.
Task 5: baselines and stack counting
The core idea: you cannot detect abnormal without knowing normal, and in AD “normal” means enormous volume. Computer accounts, the ones ending in $, do most of the talking. The room’s own comparison query bears this out on this dataset:
index=win EventCode IN (4624, 4768, 4769)
| eval AccountType=if(like(Account_Name, "%$%"), "Computer Account", "User Account")
| stats count by AccountType, EventCode | sort AccountType, -count
#   Computer Account  4624  528 | 4768  9 | 4769  9
#   User Account      4624   66 | 4769 29 | 4768  6
528 of 594 successful logons are machine-to-machine. So the answer to the suffix question is $, and the practical consequence is that NOT Account_Name="*$*" belongs in almost every user-focused hunt you write.
Stack counting, count each value, sort by frequency, then read the bottom of the list, is the technique the task is really teaching. Applied to service ticket requests:
index=win EventCode=4769 | stats count by Service_Name | sort -count
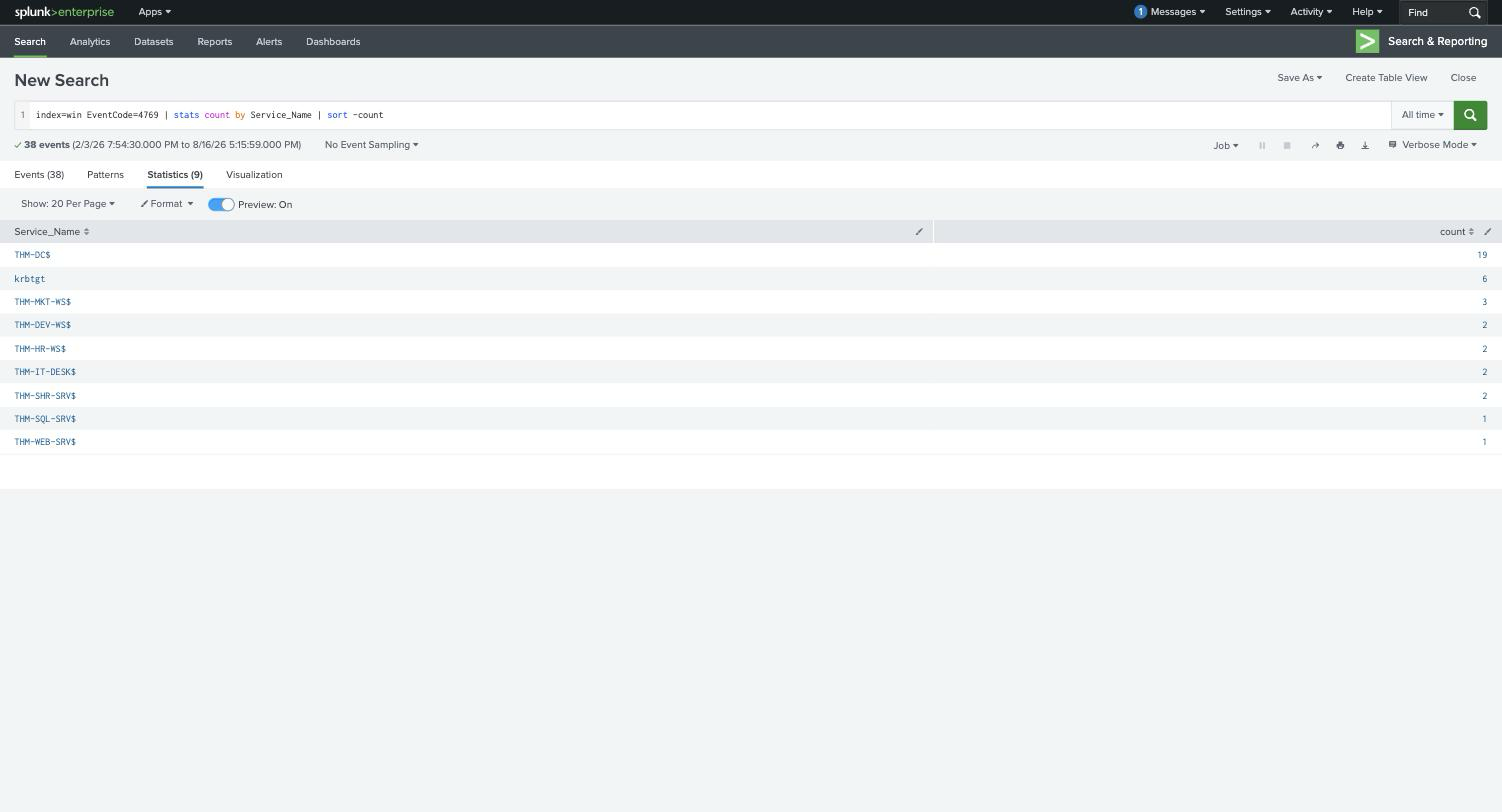
The most frequently requested service is THM-DC$ with 19 requests, followed by krbtgt at 6 and then a long tail of workstation and server accounts down to a single request each. That top entry is the baseline; the ones at the bottom with a count of 1 are where you would start an investigation in a real environment. The same pattern works on Client_Address, Account_Name, or Ticket_Encryption_Type, anywhere a rare value is more interesting than a common one.
Task 6: audit policy configuration
None of the above matters if the events are never written. Several of the categories this room depends on, DS Access in particular, are off by default on Windows, so the Advanced Audit Policy Configuration under Computer Configuration → Policies → Windows Settings → Security Settings has to be set before you have any data at all. The minimum set covers Credential Validation (4776), Kerberos Authentication Service (4768, 4771), Kerberos Service Ticket Operations (4769), User Account Management (4720/4722/4724/4725), Security Group Management (4728/4732/4756), Directory Service Changes (5136), Logon (4624/4625), and File Share (5140).
To verify what is actually enabled on a DC, the graded answer is:
auditpol /get /category:*
Or, for one subcategory at a time, auditpol /get /subcategory:"Kerberos Service Ticket Operations". Every subcategory in that list should read Success and Failure.
Task 7: the new employee onboarding audit
The practical. A new marketing hire joined yesterday and the security team needs to verify the account creation and first-day activity. Four questions, and rather than answering them one at a time it is cleaner to reconstruct the whole sequence in a single query, creation, group assignment, and first authentication, sorted chronologically:
index=win (EventCode=4720 OR EventCode=4728 OR EventCode=4768) (nathan.brooks OR "Nathan Brooks")
| eval who=coalesce(SAM_Account_Name, Member_Account_Name, Account_Name)
| table _time, EventCode, who, Group_Name, Subject_Account_Name, Client_Address
| sort _time
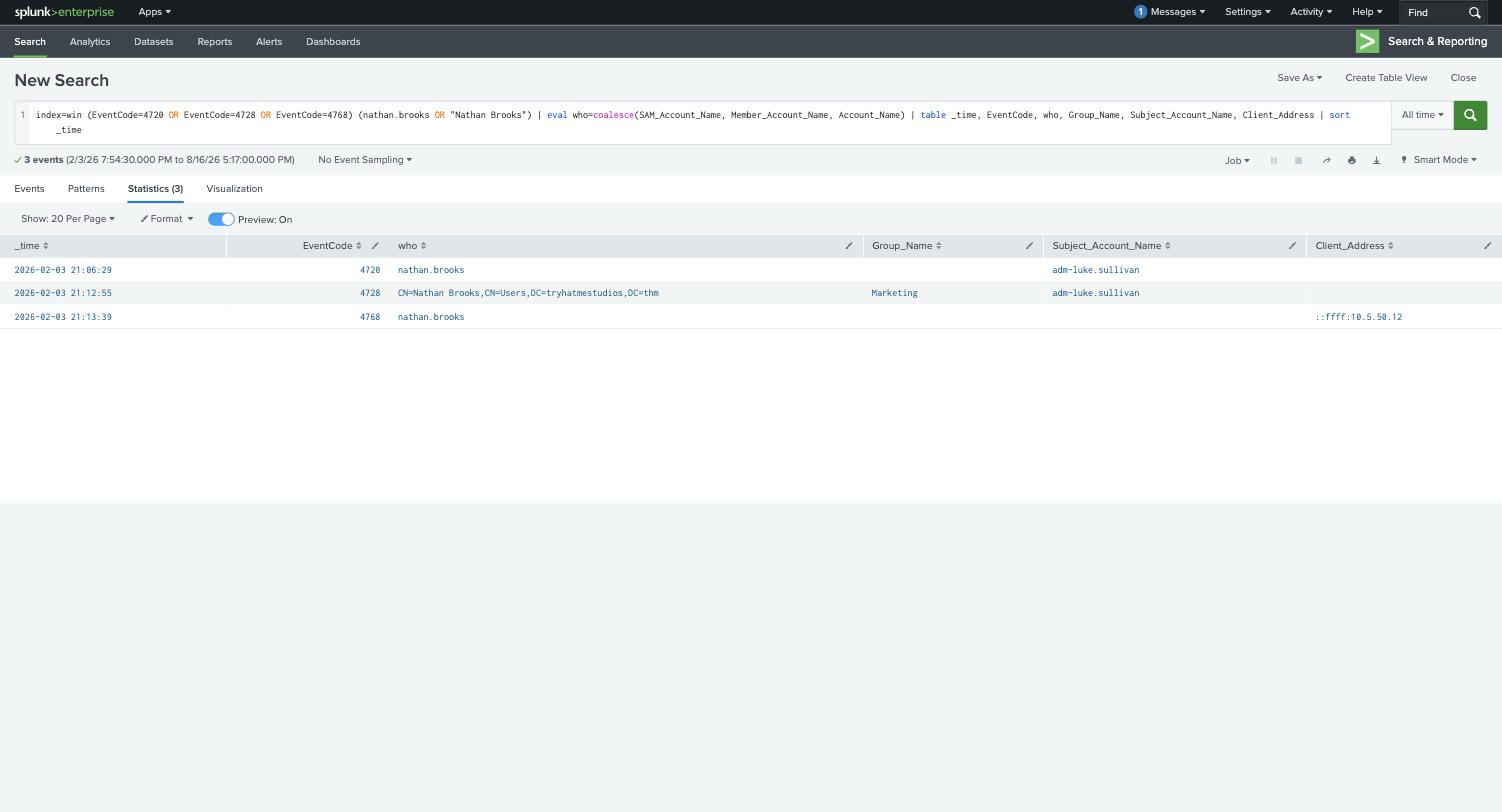
Three events, and the whole onboarding story reads off them:
| Time (UTC) | Event | What happened |
|---|---|---|
| 2026-02-03 21:06:29 | 4720 | Account nathan.brooks created by adm-luke.sullivan |
| 2026-02-03 21:12:55 | 4728 | CN=Nathan Brooks,CN=Users,DC=tryhatmestudios,DC=thm added to the Marketing group by adm-luke.sullivan |
| 2026-02-03 21:13:39 | 4768 | First TGT requested from ::ffff:10.5.50.12 |
So: the new account is nathan.brooks, created by adm-luke.sullivan, added to Marketing, and its first TGT came from 10.5.50.12.
Two details are worth pausing on. First, the 4728 event identifies the member by full distinguished name, not by SAM account name, so a naive Member_Account_Name=nathan.brooks filter finds nothing. Search on the raw string or match the DN.
Second, Client_Address is ::ffff:10.5.50.12, an IPv4-mapped IPv6 address. Windows writes it that way; the answer the room wants is the plain IPv4 form, 10.5.50.12. Pivoting to the matching logons ties the address to a machine:
index=win EventCode=4624 Account_Name=nathan.brooks
| table _time, host, Workstation_Name, Source_Network_Address, Logon_Type | sort _time
#   21:13:39  THM-DC       -            10.5.50.12    3
#   21:13:39  THM-MKT-WS   THM-MKT-WS   192.0.2.254  10
The DC-side 4624 carries Source_Network_Address = 10.5.50.12, and the session itself lands on host THM-MKT-WS, a marketing workstation, which is exactly what you would hope for. Six minutes from creation to group assignment, forty-four seconds from group assignment to first logon, from an admin account and a workstation that both fit the story. Nothing to escalate.
Task 8: what the room is actually teaching
The takeaway that carries beyond this room is the last one: individual events are data, correlated sequences are evidence. A 4720 on its own is an account being created, which happens every week. A 4720 followed six minutes later by a 4728 into a privileged group and then a 4768 from an address that has never been seen before is an incident. The event IDs are just vocabulary; the investigation is in the ordering.
The other thing worth carrying forward is the discipline of the $ filter and the long tail. On this small dataset the anomalies are easy to spot, but the ratio the room demonstrates, 528 machine logons against 66 human ones, is the reason stack counting exists. In a 500-user domain, the interesting account is never at the top of the list.
Room solved 100%: eight tasks, 104 points.