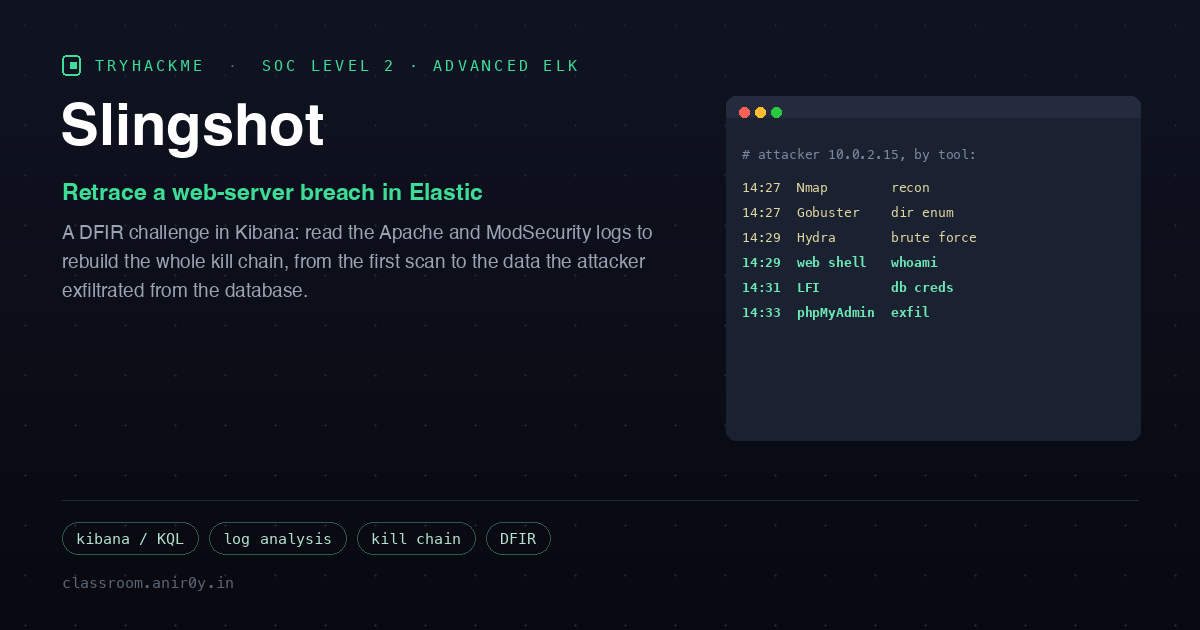
Slingshot
Slingway Inc., a toy company, noticed suspicious activity on its e-commerce web server and possible tampering with its database. This SOC Level 2 room drops you in front of an Elastic Stack loaded with the server’s Apache and ModSecurity audit logs and asks a single question: can you reconstruct exactly what the attacker did, in order, from first packet to data theft? It is a pure log-analysis challenge, no exploitation of your own, just evidence, and the whole investigation lives in Kibana’s Discover view.
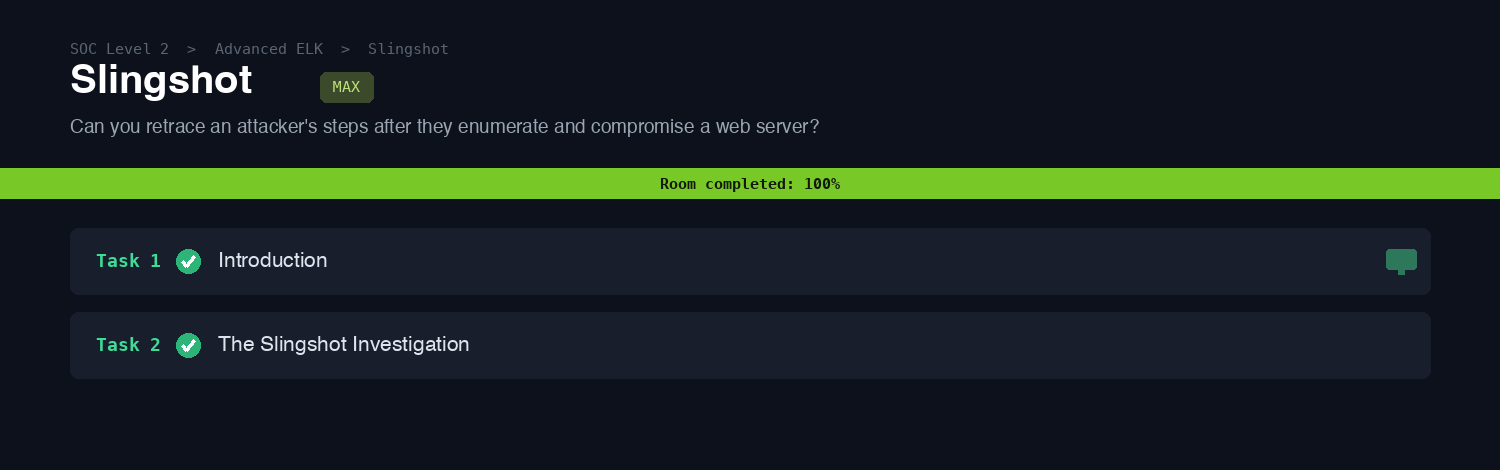
The IT team gave one anchor: the activity started on July 26, 2023. So the first move is to open Discover, select the pre-built apache_logs data view, and set the time range to Jul 26 2023 through now. Every log line is a ModSecurity audit record with clean fields to pivot on: transaction.remote_address (the client IP), request.request_line, request.headers.User-Agent, and response.status.
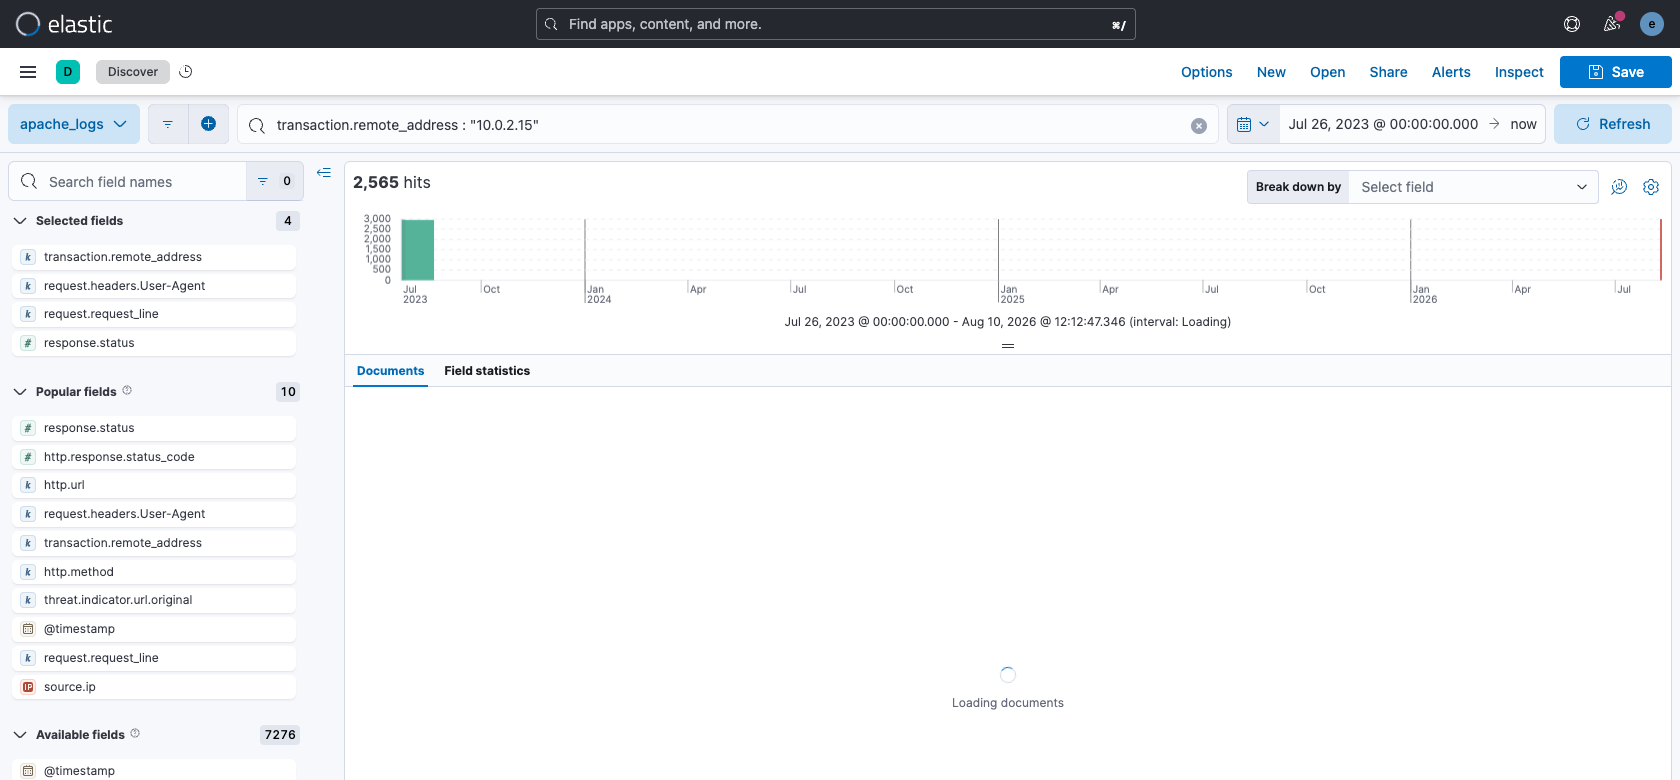
A quick aggregation on the source IP settles the first question immediately: one host, 10.0.2.15, is responsible for 2,565 requests while every other address sits in the low tens. That is the attacker. Everything else is just filtering this host’s traffic by time and user-agent.
I ran the investigation two ways in parallel, which is why the screenshots below alternate: the Discover UI for the visual pivot, and curl against Kibana’s console proxy in a terminal for fast aggregations. Both hit the same Elasticsearch data.
Recon and enumeration
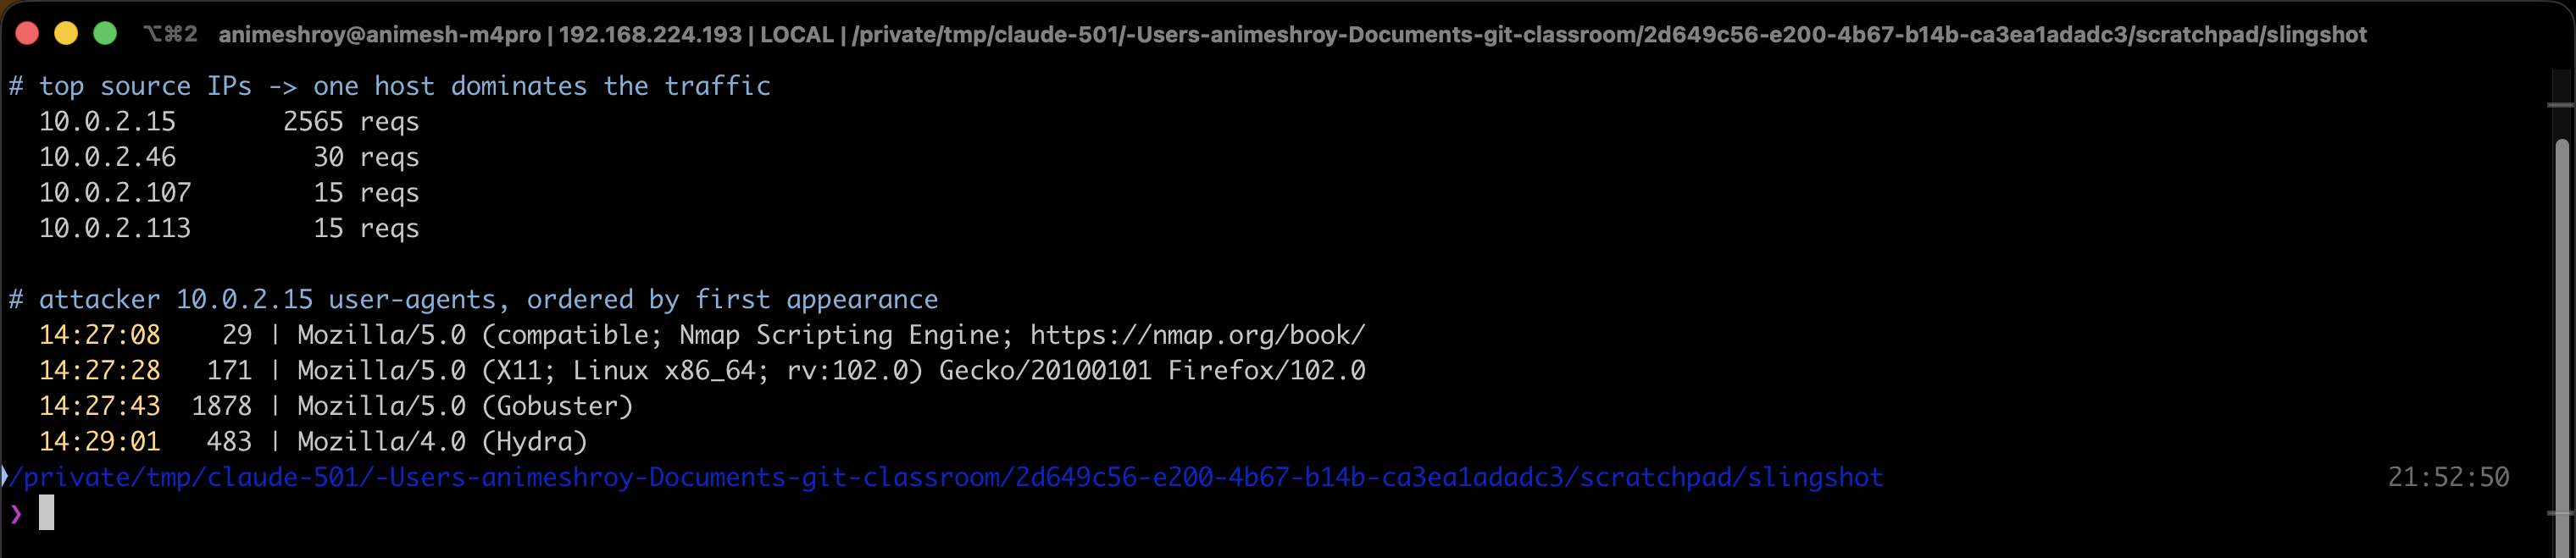
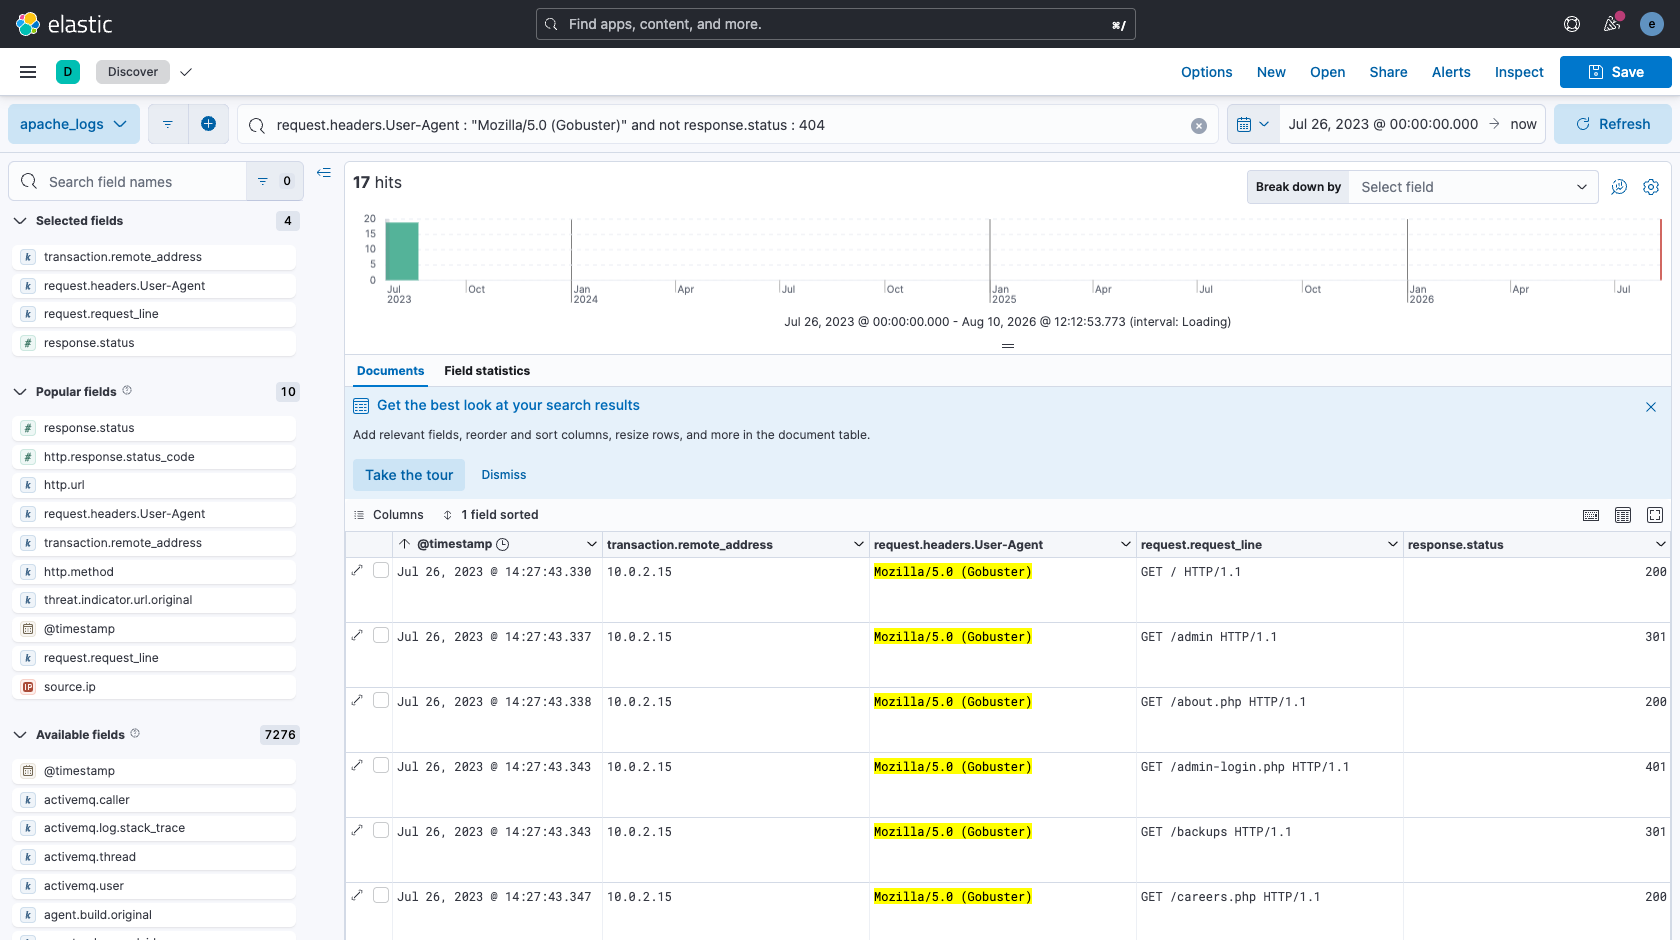
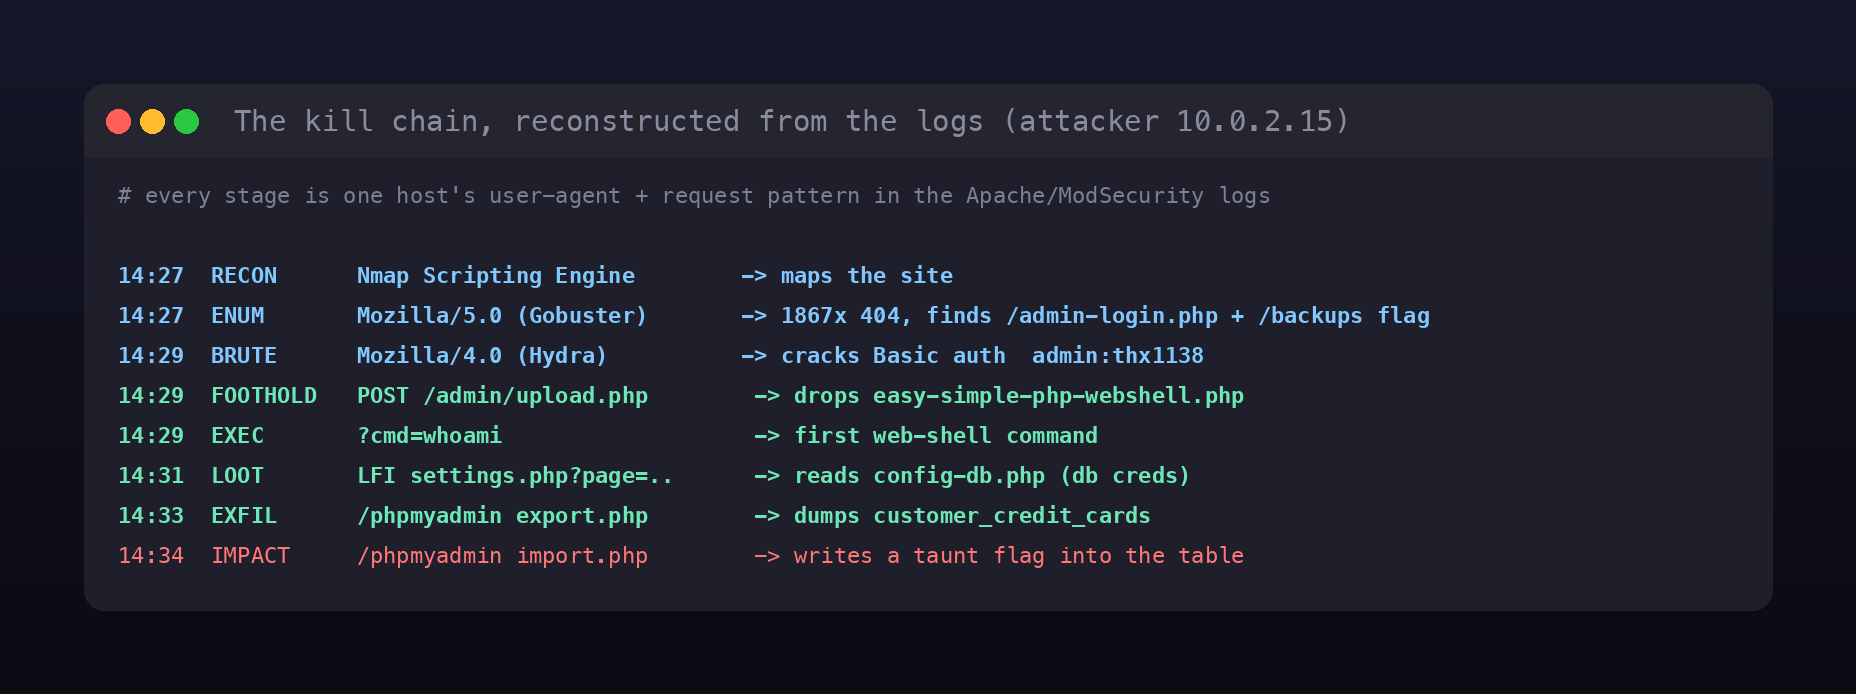
Bucketing the attacker’s requests by user-agent and sorting on the earliest timestamp lays the entire toolkit out as a timeline. At 14:27:08 the first tool appears: the Nmap Scripting Engine, the answer to the first-scanner question. Thirty seconds later a Firefox user-agent shows up (the attacker browsing by hand), and at 14:27:43 the noise begins, Mozilla/5.0 (Gobuster), the directory-enumeration tool, firing nearly 1,900 requests.
Filtering to that Gobuster user-agent and counting the 404 responses answers the enumeration-volume question: the attacker drew 1867 total 404s while brute-forcing paths. Far more interesting are the requests that did not 404, because those are the real discoveries.
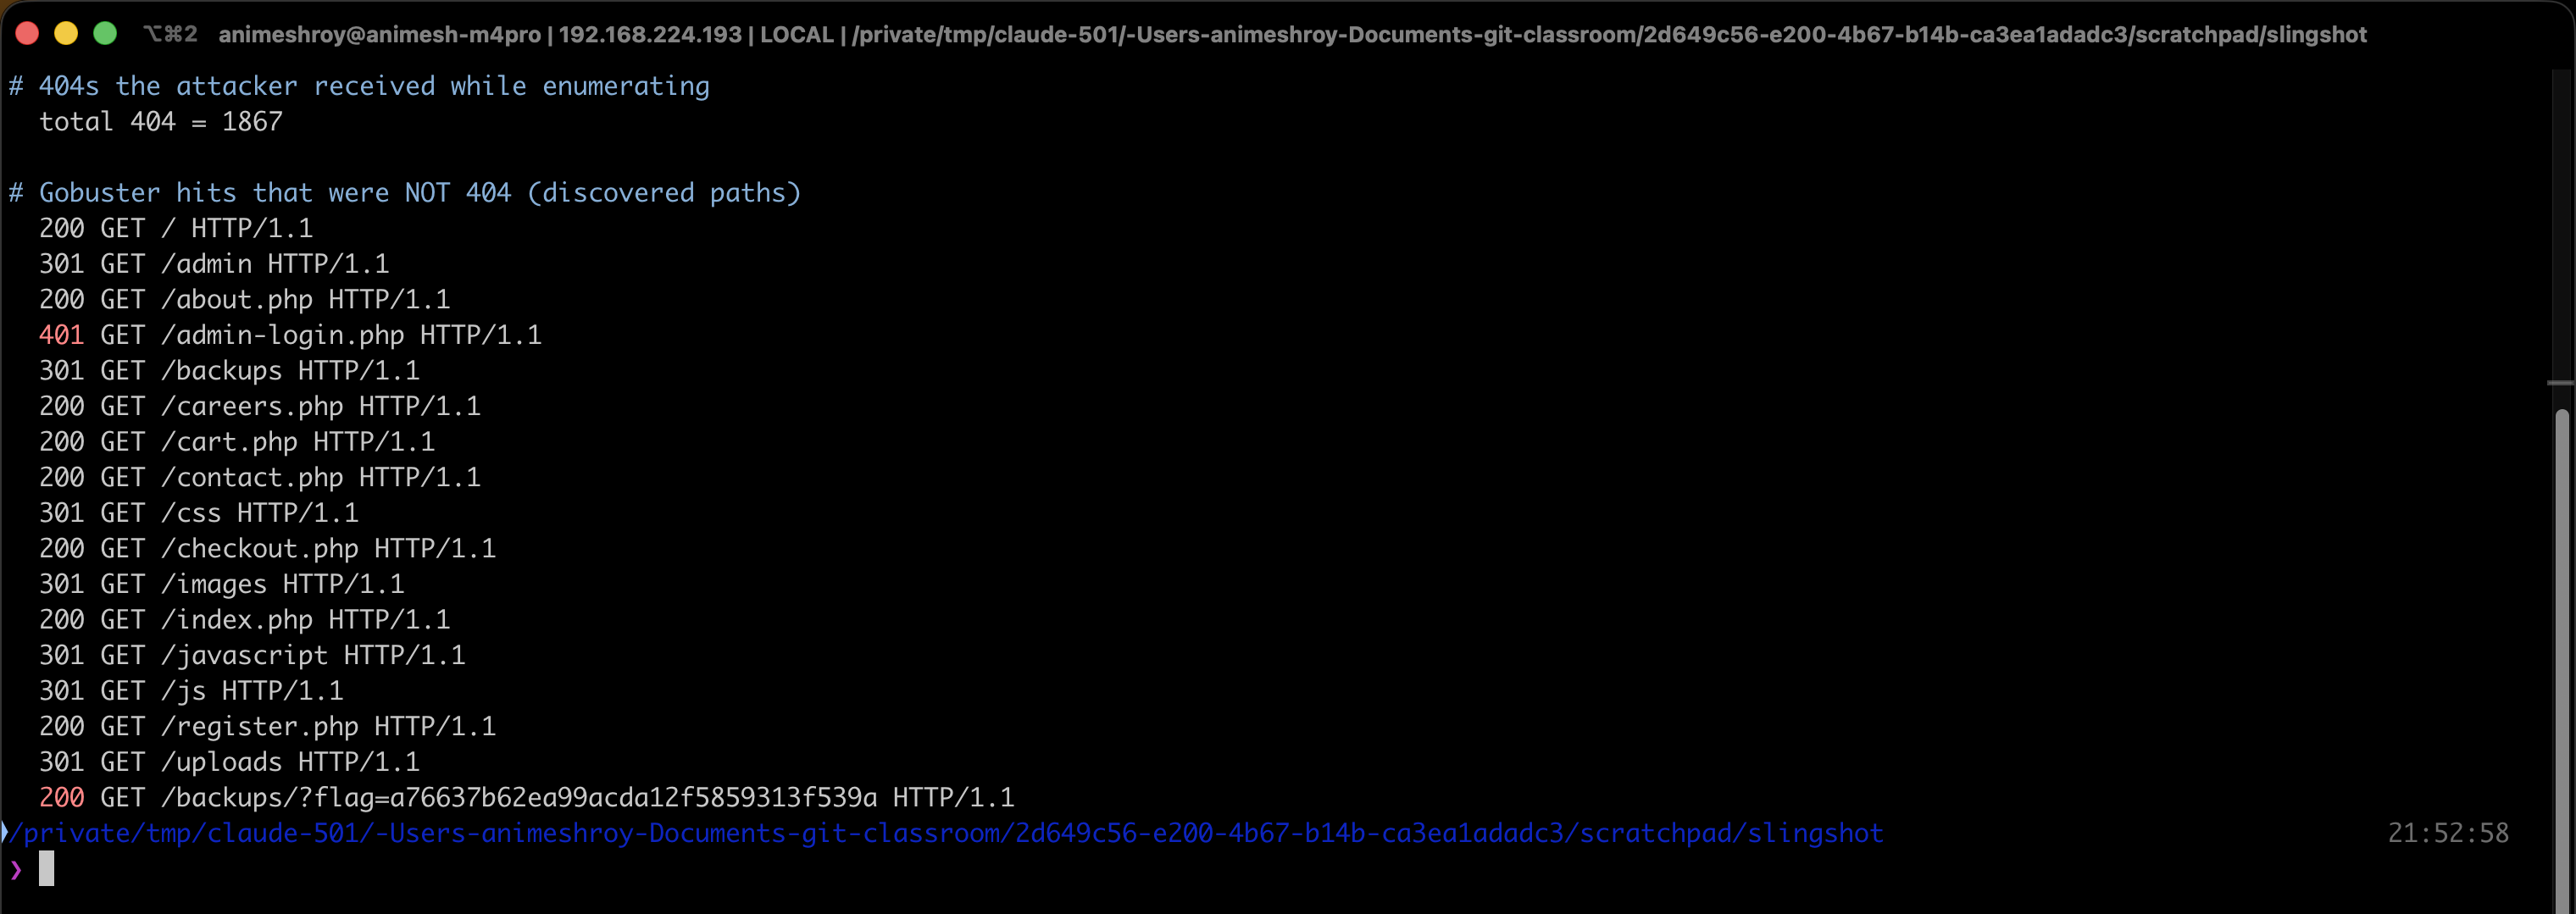
Stripping out the 404s leaves seventeen hits, and two of them matter. GET /admin-login.php returns 401, an authentication-protected page, which is the login page the attacker discovered. And GET /backups/?flag=a76637b62ea99acda12f5859313f539a returns 200, leaking a flag straight in the URL: the directory-enumeration flag is a76637b62ea99acda12f5859313f539a.
Gaining access
With a login page found, the attacker’s next user-agent is Mozilla/4.0 (Hydra) at 14:29:01, the brute-force tool. The /admin-login.php page uses HTTP Basic authentication (that is why it answered 401), so Hydra hammered the Authorization header until one request finally succeeded. ModSecurity captured that header in full, and because Basic auth is just base64, the credentials fall straight out.

The header Authorization: Basic YWRtaW46dGh4MTEzOA== decodes to admin:thx1138, the credentials that unlocked the admin panel. Once inside, the attacker went straight to POST /admin/upload.php and dropped a file. ModSecurity logs the request body, so the entire PHP web shell is sitting in the record, easy-simple-php-webshell.php, a classic system($_GET['cmd']) one-liner, with a flag left as a comment: THM{ecb012e53a58818cbd17a924769ec447}.
Post-exploitation and exfiltration
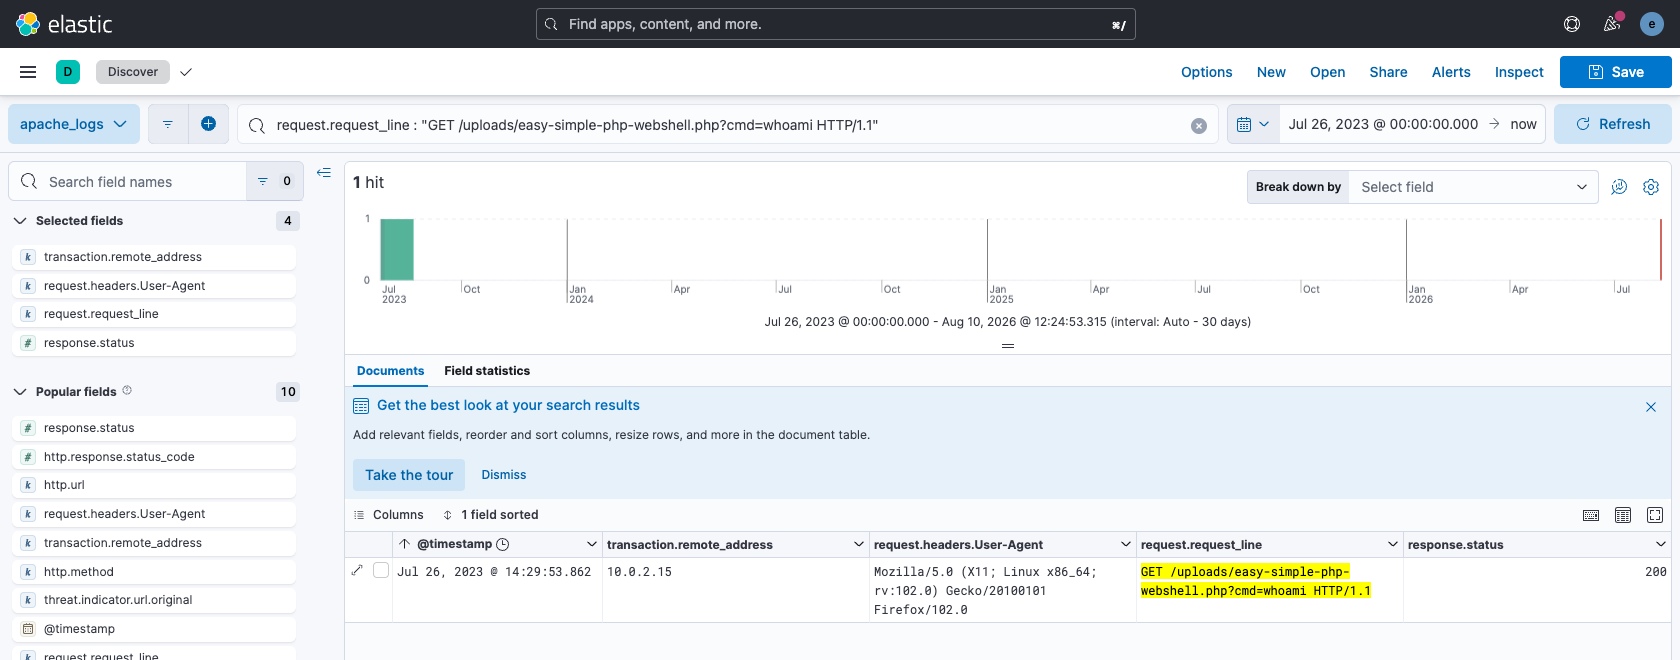
From here the attacker used the web shell interactively. Filtering the request lines for that uploaded file shows the command sequence, and the very first one run is whoami (GET /uploads/easy-simple-php-webshell.php?cmd=whoami), followed by pwd, ls, and which nc.
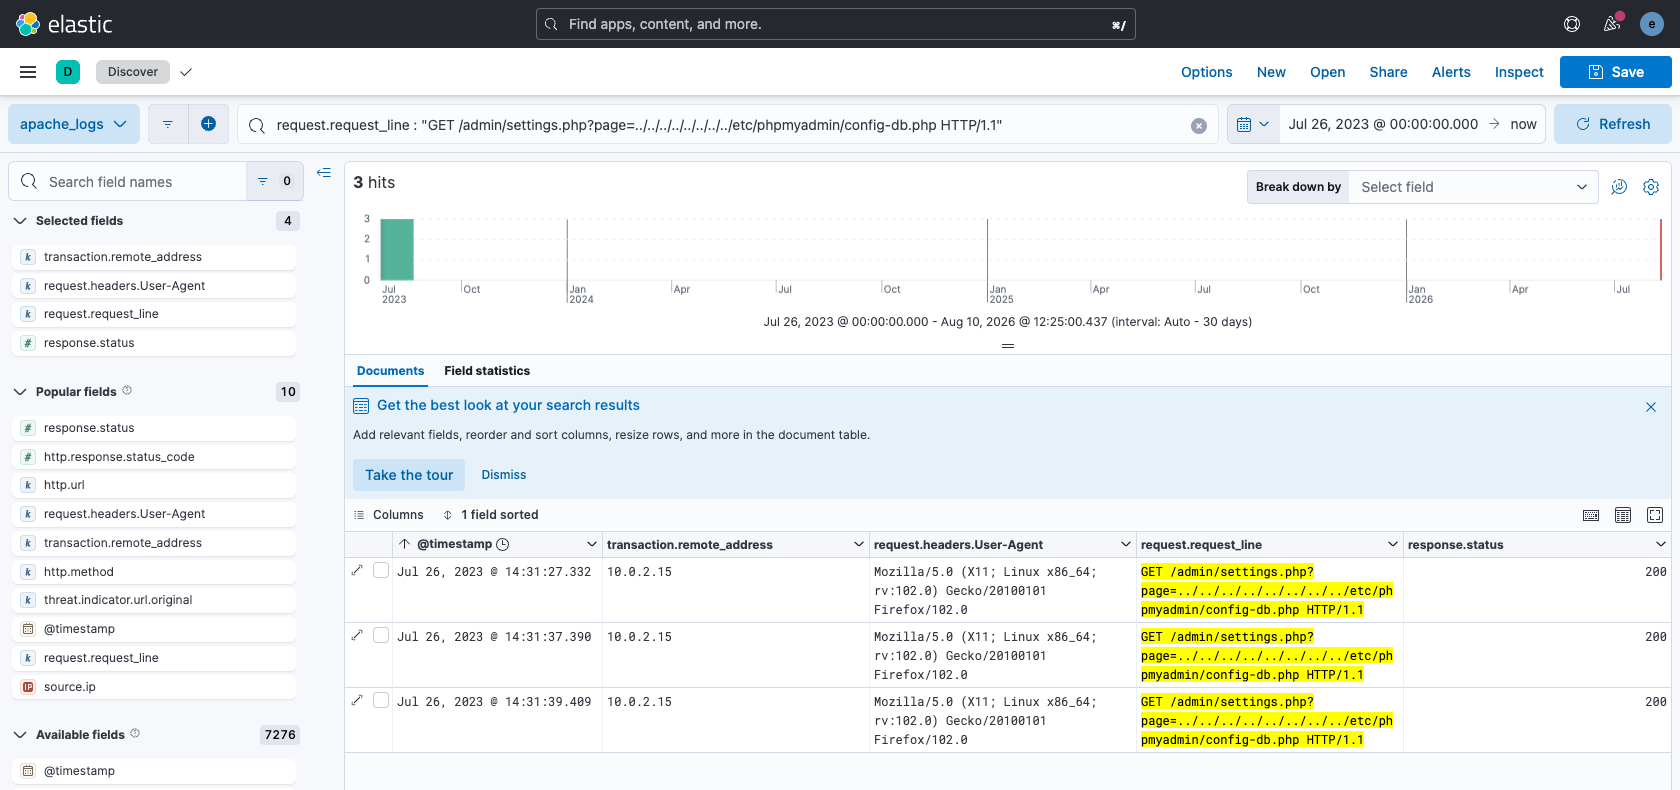
Next the attacker pivoted to the admin panel’s settings.php, which turned out to be vulnerable to Local File Inclusion. A run of settings.php?page=../../../../../../../../etc/... requests walks the filesystem, and the one that matters targets config-db.php, phpMyAdmin’s database-credentials file. Reading it (including a php://filter base64 trick to grab the raw source) handed over the database login.
Armed with those creds, the attacker logged into /phpmyadmin and went after the data. The navigation and export requests all carry db=customer_credit_cards, so the exported database is customer_credit_cards, and POST /phpmyadmin/export.php is the dump itself. The final act is pure taunt: a POST /phpmyadmin/import.php whose body is an INSERT into the credit_cards table, writing a flag into the cardholder_name column, c6aa3215a7d519eeb40a660f3b76e64c.
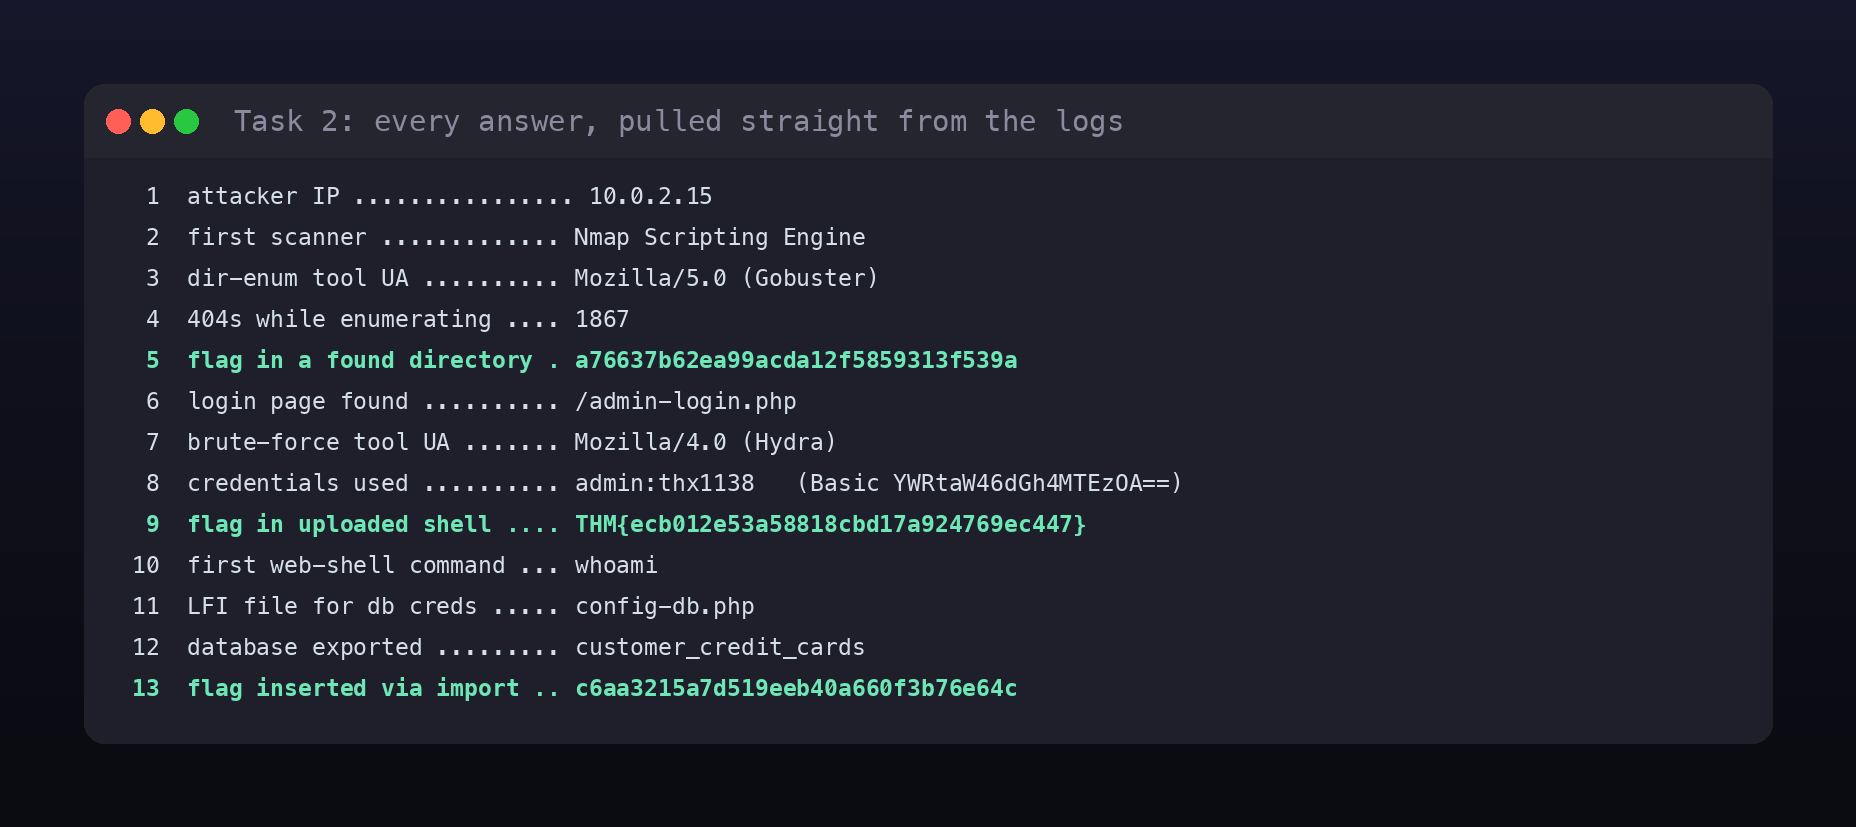
Every answer
Each answer came straight out of one field pivot in the logs, no guessing required.
Room summary
| Room | Slingshot (SOC Level 2, Advanced ELK) |
| Category | DFIR / log analysis, Easy |
| Data | Apache + ModSecurity audit logs in Elastic, apache_logs data view |
| Attacker | 10.0.2.15 |
| Chain | Nmap recon, Gobuster enum, Hydra brute-force, web-shell upload, LFI for DB creds, phpMyAdmin exfiltration |
| Key creds | admin:thx1138 (Basic auth), DB creds from config-db.php |
Wrap-up
Slingshot is a clean lesson in why centralised, structured logging wins incident response. Every stage of a full compromise, reconnaissance, enumeration, credential brute-forcing, a web-shell foothold, local file inclusion, and database exfiltration, left a distinct fingerprint in one field or another: a user-agent, a status code, an Authorization header, a request body. Because ModSecurity captured the request bodies, even the uploaded web shell and the attacker’s SQL were fully recoverable after the fact. The skill the room builds is not any single query but the habit of pivoting, pick the attacker’s IP, sort by time, and let each tool’s signature tell you what happened next. That timeline, built from evidence rather than assumption, is exactly what an incident-response report is made of.