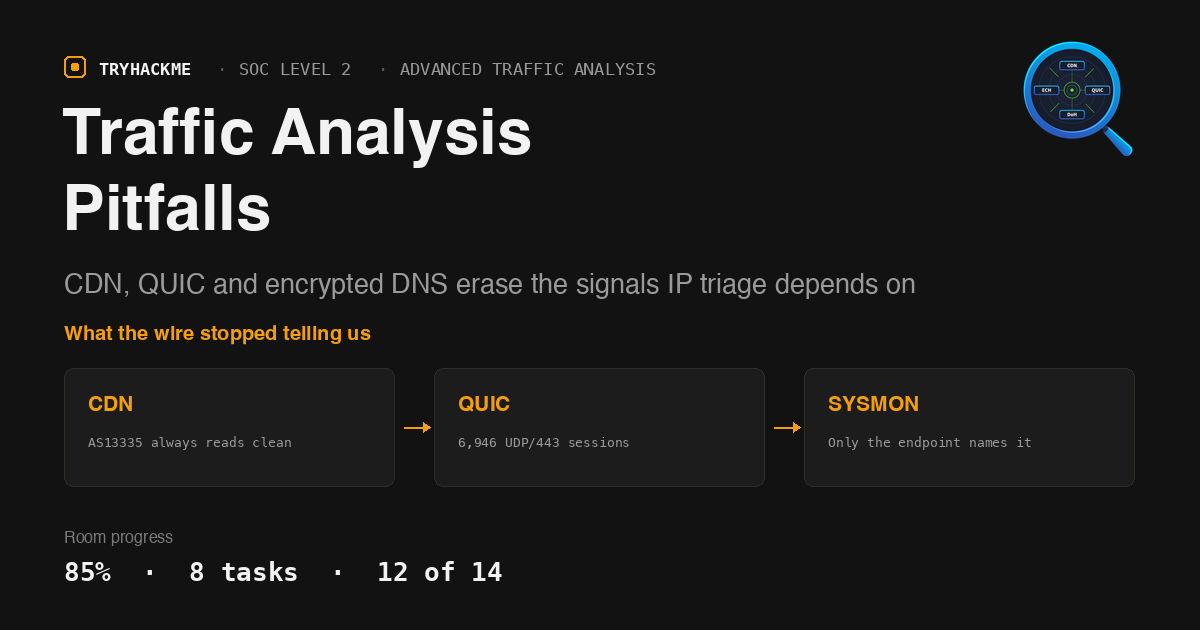
Traffic Analysis Pitfalls
Part of the Advanced Traffic Analysis module on SOC Level 2, and the one room in it that is about what you cannot see. Network Monitoring with Zeek reduced an intrusion to structured logs, and Advanced Packet Analysis opened the capture to read the bytes. This room starts from the opposite end: a firewall alert with a destination IP, a byte count and a duration, where the DNS record, the TLS SNI and the proxy log are all simply absent.
The alert is deliberately unhelpful:
Alert: Large Outbound Transfer, Source 10.10.15.44 (WKST-FINANCE-04), Destination 172.67.153.42:443, Protocol UDP, Bytes Out 847 MB, Duration 4h 12m, Time 2026-04-02 02:47 UTC. IP reputation: clean.
Everything runs in Splunk against index=lab, with the time picker on All Time, the data is backdated to March and April 2026, so the default Last 24 hours returns an empty result set that looks exactly like a broken lab.
Two things worth stating up front, because this writeup is not a clean 100%.
The lab machine shipped with an empty index. On boot, index=lab had zero events. I recovered it, and the recovery is documented below, it is the most transferable thing in the room.
Two of the fourteen answers cannot be derived from the shipped dataset. The room’s prose describes numbers the current data generator provably cannot produce. That is also documented below, with the arithmetic.
Setup: the index was empty, and fixing it
The room says to give the lab five minutes and open Splunk at the reverse-proxy URL. Splunk came up fine. The data did not.
# Splunk knows about the index. It just has nothing in it.
# /services/data/indexes/lab -> totalEventCount: 0, currentDBSizeMB: 1
The monitor inputs are all present and pointed at the right place:
/home/ubuntu/splunk_lab_logs/fortigate/   index=lab  sourcetype=fortigate_traffic
/home/ubuntu/splunk_lab_logs/netflow/     index=lab  sourcetype=netflow
/home/ubuntu/splunk_lab_logs/sysmon/      index=lab  sourcetype=sysmon
/home/ubuntu/splunk_lab_logs/zeek/        index=lab  sourcetype=zeek_conn
_internal shows TailingProcessor adding watches on all four directories at boot, and then nothing. No per_index_thruput series for lab at all. That signature means the files were already read once, during image build, and the fishbucket still says so, while the index buckets did not survive into the shipped image. The monitor is doing exactly what it is told: skipping files it believes it has already consumed.
The fix is a one-shot ingest, which uses a different fishbucket key. Splunk Web’s REST proxy is reachable from the page’s own JavaScript context, and the session is admin:
POST /en-US/splunkd/__raw/services/data/inputs/oneshot
  name=/home/ubuntu/splunk_lab_logs/fortigate/fortigate_traffic.log
  index=lab  sourcetype=fortigate_traffic
Repeated for netflow/netflow.json, zeek/conn.log and sysmon/sysmon_events.json. Twelve seconds later:
sourcetype            count
fortigate_traffic     18187
netflow               19511
sysmon                 8220
zeek_conn             35789
Finding the filenames without a shell is its own small trick. oneshot returns two distinguishable errors, unable to open file ... No such file or directory versus invalid file ... Not a regular file, so posting candidate paths at a deliberately non-existent index turns the endpoint into a file-existence oracle. Four guesses per directory found all four files.
One caveat to carry into the rest of the room: the zeek directory contains only conn.log. There is no dns.log, so sourcetype=zeek_dns returns nothing. That happens to be fine, because the one place the room queries it (Task 7, Step 6) is expecting zero results.
Task 2: ASN enrichment, because the IP is meaningless
172.67.153.42 is Cloudflare. Reputation feeds return clean because clean is the correct answer for an anycast address fronting millions of services. The pivot is to stop asking is this IP bad and start asking what kind of organisation runs it, which is what the asn_lookup table answers at query time.
index=lab sourcetype=fortigate_traffic
| lookup asn_lookup network AS dstip OUTPUT dst_asn_org dst_category dst_risk
| stats count by dst_category dst_risk
| sort -count
dst_category                dst_risk   count
CDN                         low         8194
Cloud Provider              low         5087
Unknown                     medium      2835
Video Conferencing          low          794
Software Update             low          745
DNS Resolver                low          522
Tor Exit / Anonymisation    high           6
Bulletproof Hosting         high           4
Eighteen thousand rows collapse to eight categories, and the two that matter are the two smallest. 4 connections resolve to Bulletproof Hosting.
The behavioural half of the task is the beacon shape. Bucketing the alert’s source-destination pair by hour and taking the byte extremes shows the keepalive floor directly:
index=lab sourcetype=fortigate_traffic srcip=10.10.15.44 dstip=172.67.153.42
| eval hour=strftime(_time,"%Y-%m-%d %H")
| stats count as per_hour min(sentbyte) as min_b max(sentbyte) as max_b by hour
| sort -per_hour | head 15
17 connections an hour, across 328 hours, with min_b bottoming out at 800 bytes. That floor is the beacon; the max_b spikes riding above it are the data bursts. A browser does not produce a flat 17-per-hour floor for two weeks.
Task 3: QUIC, and why the IDS never fired
The detection stack watches TCP/443. HTTP/3 does not use it.
index=lab sourcetype=zeek_conn "id.resp_p"=443
| eval transport=if(proto="udp","QUIC (UDP/443)","HTTPS (TCP/443)")
| stats count by transport
transport            count
HTTPS (TCP/443)      10496
QUIC (UDP/443)        6946
6,946 sessions on port 443 that an alert TCP any any -> any 443 rule will never match, and that the proxy never terminated. That is 40% of port-443 traffic in this dataset. (The room’s prose says “approximately 22%”, which is the QUIC share of all Zeek traffic, 6,946 of 35,789, rather than of port 443. The question asks for the count, so the discrepancy does not bite, but it is worth noticing that the two framings differ by nearly a factor of two.)
Filtering QUIC to sessions no browser would produce surfaces the alert on its own:
index=lab sourcetype=zeek_conn service=quic
| lookup asn_lookup network AS "id.resp_h" OUTPUT dst_asn_org dst_category
| where duration > 3600
| table _time "id.orig_h" "id.resp_h" duration orig_bytes resp_bytes dst_asn_org
_time                  id.orig_h     id.resp_h        duration  orig_bytes  resp_bytes  dst_asn_org
2026-04-02 02:47:00    10.10.15.44   172.67.153.42     15180.0   847823104     2097152  Cloudflare Inc.
Exactly one row: 15180 seconds, 847 MB out against 2 MB in. The asymmetry is the tell, and the transport is why there is no proxy log to correlate against.
Task 4: the host that went quiet
DoH does not announce itself. What it leaves behind is an absence, a workstation that generated a couple of hundred DNS queries a day and then generates none.
index=lab sourcetype=zeek_conn "id.orig_h"="10.10.12.23" "id.resp_p"=53 proto=udp
| timechart span=1d count
2026-03-24  201
2026-03-25  215
2026-03-26  205
2026-03-27  (no rows)
The last day with UDP/53 traffic from WKST-MKTG-07 is March 26, so the first day it appears with zero is 2026-03-27. Answer format is YYYY-MM-DD, and the underscore mask (ten characters) confirms it before you submit.
The confirmation is the other half of the pair, the traffic that replaced it:
index=lab sourcetype=zeek_conn "id.orig_h"="10.10.12.23" "id.resp_p"=443
| search "id.resp_h"="1.1.1.1" OR "id.resp_h"="8.8.8.8"
| timechart span=1d count by "id.resp_h"
2026-03-27   1.1.1.1: 14    8.8.8.8: 12
2026-03-28   1.1.1.1: 12    8.8.8.8:  9
Zero before March 27, then both resolvers light up on the same day UDP/53 stops. 26 DoH connections across both resolvers on the switch date. Two signals confirming each other beats either one alone: a host can stop querying DNS because it was powered off, but it does not simultaneously start hitting 1.1.1.1 on 443.
Task 5: the log hierarchy, and the question only Sysmon answers
FortiGate says the connection was allowed. NetFlow independently agrees on the byte counts. Zeek names the transport as QUIC. None of the three can say what is generating it, because process identity does not exist at the network layer.
index=lab sourcetype=sysmon DestinationIp=172.67.153.42
| stats count by Image
| sort -count
Image                                                            count
C:\Program Files\Microsoft Office\root\Office16\EXCEL.EXE         3060
C:\Program Files\Mozilla Firefox\firefox.exe                        74
C:\Program Files\Google\Chrome\Application\chrome.exe               69
The answer is the full path, C:\Program Files\Microsoft Office\root\Office16\EXCEL.EXE, not the bare image name. The mask settles it without a wasted attempt: it reads _:\_______ _____\_________ ______\____\________\_____.___, which is a drive letter, then 7, 5, 9, 6, 4, 8, 5 and a three-character extension. Program Files\Microsoft Office\root\Office16\EXCEL.EXE fits every segment.
The signal is the ratio, not the number. Browsers hitting a Cloudflare address incidentally show tens of connections spread across many short-lived PIDs. Excel shows three thousand from a single PID that never restarts. Excel is not a QUIC client.
Task 6: enrichment finds what reputation missed
Same lookup, filtered to risk rather than category:
index=lab sourcetype=fortigate_traffic
| lookup asn_lookup network AS dstip OUTPUT dst_asn_org dst_category dst_risk
| where dst_risk="high"
| stats count by srcip dstip dst_asn_org dst_category
srcip          dstip             dst_asn_org                      dst_category                count
10.10.11.18    185.220.101.34    F3 Netze e.V.                    Tor Exit / Anonymisation        6
10.10.13.67    185.213.154.88    Stark Industries Solutions Ltd   Bulletproof Hosting             4
6 connections to a Tor exit relay. Both destinations pass every reputation feed. The only reason either surfaces is that the ASN operator is named.
Here the room’s query and the room’s data disagree, and it is worth walking through rather than glossing over. The taught query tables srcname, and the question asks for “the srcname of the workstation”. There is no srcname field. The FortiGate events are the standard key-value format and carry no hostname at all:
date=2026-03-22 time=22:46:09 devname="FG-CORP-01" ... srcip=10.10.11.18 srcport=51421
srcintf="internal" dstip=185.220.101.34 dstport=443 proto=6 action="accept"
service="HTTPS" app="HTTPS.BROWSER" appcat="Web.Client" apprisk="high"
duration=39 sentbyte=16374 rcvdbyte=31438
Adding srcname to a stats ... by clause silently drops every row, because stats by discards events where a grouping field is null, which is why the taught query appears to return nothing. There is no host_lookup in the app either; asn_lookup.csv is the only lookup table installed.
The hostname does exist, just in the sourcetype that carries endpoint identity:
index=lab sourcetype=sysmon SourceIp=10.10.11.18 | head 1
{"EventID": 3, "TimeCreated": "2026-04-06T21:03:15.000Z", "Computer": "WKST-HR-02",
 "ProcessId": 1921, "Image": "C:\\Program Files (x86)\\Microsoft\\Edge\\Application\\msedge.exe",
 "User": "CORP\\a.patel", "SourceIp": "10.10.11.18",
 "SourceHostname": "WKST-HR-02.corp.internal", "DestinationIp": "54.192.130.74"}
WKST-HR-02, ten characters, matching the mask exactly. An HR workstation reaching a Tor exit at two-minute intervals is automated tooling, not someone browsing.
Task 7: closing the case, and where it stops
Steps 1 to 3 land cleanly. ASN enrichment confirms Cloudflare, the daily timechart shows beaconing from March 17 with a spike on April 2, and isolating that day returns 212 connections:
index=lab sourcetype=fortigate_traffic srcip=10.10.15.44 dstip=172.67.153.42
  earliest="04/02/2026:00:00:00" latest="04/03/2026:00:00:00"
| table _time srcip dstip dstport proto sentbyte rcvdbyte duration
| sort -sentbyte
_time                  proto  sentbyte     rcvdbyte   duration
2026-04-02 02:47:00       17  847823104     2097152      15180
2026-04-02 16:02:xx       17       1187         318          3
...210 more rows in the 1,100-1,200 byte range
847823104 bytes outbound, against 2 MB in, over 4 hours 12 minutes, while the ordinary keepalives kept firing around it all day.
Then process attribution, and this is where the room and its data part company. The query returns EXCEL.EXE / PID 4812 with 3,060 connections, first seen 2026-03-17 07:59:31 and last seen 2026-04-06 21:56:30, at 134-159 connections per day across 21 days. The room’s text says “6,000+ connections” and “daily counts in the 270-310 range”.
Both of my remaining answers were rejected, so I went looking for which side was wrong. The dataset is generated on the box by /home/ubuntu/generate_logs.py, and it is fully deterministic:
random.seed(42)
START_DATE = datetime(2026, 3, 7,  0, 0, 0, tzinfo=timezone.utc)
END_DATE   = datetime(2026, 4, 6, 23, 59, 59, tzinfo=timezone.utc)
EXFIL_DAY        = 26      # 2026-04-02
BEACON_START_DAY = 10      # 2026-03-17
DOH_SWITCH_DAY   = 20      # 2026-03-27
def gen_beacon(day_dt, day_offset, fg, zk, sm, nf):
    """WKST-FINANCE-04: C2 beacon every 4 minutes over QUIC (excel.exe), from day 10"""
    cur = day_dt.replace(hour=8,  minute=0, second=0)
    end = day_dt.replace(hour=22, minute=0, second=0)
    while cur < end:
        ...
        if random.random() < 0.7:
            wsm(sm, bdt, host,
                "C:\\Program Files\\Microsoft Office\\root\\Office16\\EXCEL.EXE",
                pid, USERS[host], "udp", sip, sp, C2_IP, 443)
        cur += timedelta(minutes=4)
Fourteen hours at one beacon every four minutes is 210 beacons a day, a hard ceiling. The Sysmon write is gated at 70%, giving ~147 a day, which is exactly what the index shows. A daily count of 270-310 is arithmetically impossible with this generator, and so is a total above 4,410. The prose and the answer key were written against an earlier version of the generator; the shipped data is a later one. Every other constant in the script matches the accepted answers precisely, se = random.randint(800, 1200) is the 800-byte keepalive from Task 2, sent = 847823104 is the exfil, dur = 15180 is the duration, and the three day offsets produce March 17, March 27 and April 2.
Rejected attempts, for the record: 3060 and 6120 for the connection count, 2026-04-06 21:56:30 and 2026-04-02 02:47:00 for the timestamp. I stopped rather than brute-force a four-digit field.
The rest of Step 7 still works and is the point of the task anyway:
index=lab sourcetype=sysmon Image="*EXCEL.EXE" ProcessId=4812 SourceIp=10.10.15.44
| stats min(_time) as first_seen max(_time) as last_seen count
| eval first_seen=strftime(first_seen,"%Y-%m-%d %H:%M:%S")
| eval last_seen=strftime(last_seen,"%Y-%m-%d %H:%M:%S")
One PID, unbroken, from a macro-enabled workbook opened on March 17 through the April 2 exfiltration and onwards. The alert that came in at 02:47 was not the beginning of the incident. It was the sixteenth day of it.
And the reason the original alert had no DNS record to pivot on:
index=lab sourcetype=zeek_dns "id.orig_h"="10.10.15.44"
| search answers="172.67.153.42" OR query="172.67.153.42"
Zero results, against a host that makes 60-120 DNS queries a day. The C2 address is hardcoded, so there was never a hostname to resolve.
What actually generalises here
Absence is a detection, but only against a baseline. WKST-MKTG-07 going silent on UDP/53 is invisible unless you know it used to make 200 queries a day, and it is ambiguous until you find the TCP/443 traffic to 1.1.1.1 that replaced it. Neither query is interesting alone; the pair is conclusive. The same shape applies to the QUIC count, 6,946 sessions is only alarming once you know your IDS rules are scoped to TCP.
Read the data before you trust the walkthrough. Two of this room’s own queries do not survive contact with its own dataset: srcname does not exist in the FortiGate logs, and stats by on a null field silently returns nothing rather than erroring. Then the Sysmon figures in the prose turn out to exceed what the generator can emit. In a real investigation the equivalent failure is quieter and more expensive, a runbook written against last quarter’s log schema, producing an empty result that reads as “no findings” instead of “wrong field name”.
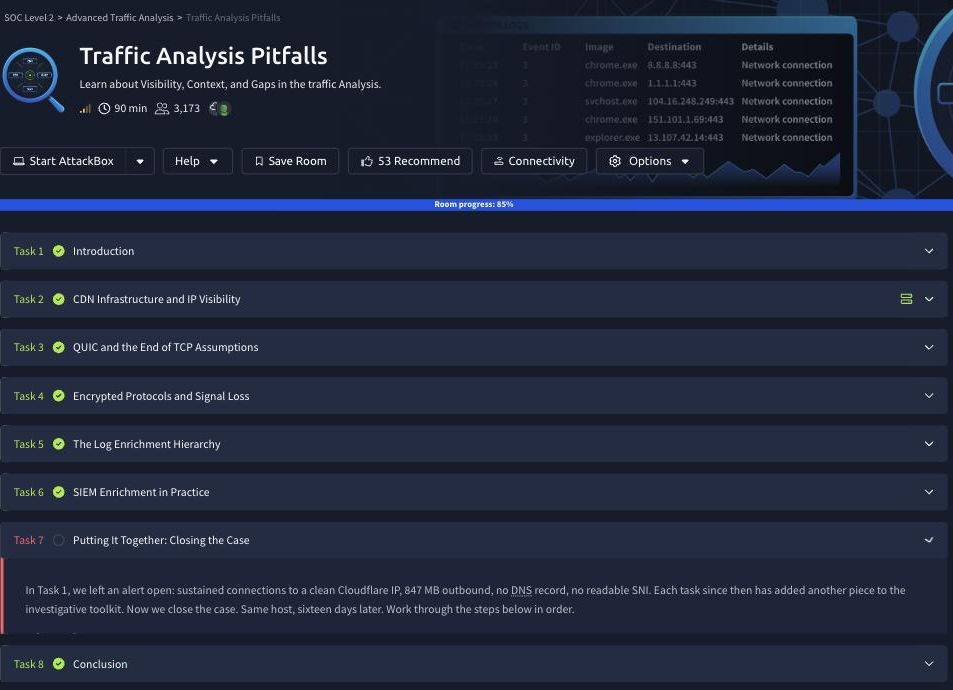
Room progress 85%, 8 tasks, 12 of 14 answers accepted. The two outstanding answers (Task 7, questions 2 and 3) are not derivable from the dataset the lab currently ships; the arithmetic is above, and I would rather leave them open than dress up a guess.