| Follow @anir0y | |
|---|---|
| Trusted By Default |  |
Trusted By Default is a premium DFIR room built around a single Splunk instance holding five log sources. The brief is short: investigate suspected abuse of a trusted service account at Aurora Retail Group. There is no exploitation to do. The whole room is one long correlation exercise where each answer becomes the pivot for the next. If you liked the log-correlation style of Conti, this is the same muscle, and it pairs naturally with Detecting AD Lateral Movement.
Two tasks, eleven answers. Task 1 is a check-in. Task 2 is the ten-question investigation. The whole incident happens on 11 August 2026, so once you find the first timestamp you can keep a tight window.
A setup note. The lab hands you a Splunk web console through a reverse-proxy URL, already logged in.
I drove it with the export API from the browser page context. One quirk worth recording: on this
Splunk 10.2.4 a GET to the export endpoint returned 405, and the POST form of the same request
worked. That is the opposite of the older 8.2.2 behaviour, so try both before assuming the console is
broken. Every search below also uses earliest=0 because the data is backdated.
Task 1: Case Briefing
The briefing sets the scene and lists the sources: IIS web logs, Windows Security events, Sysmon, and
Zeek network logs. Confirming it is a No answer needed check-in. The guidance is worth reading
twice, especially the line about using source-specific host fields rather than Splunk’s ingestion
host, and reporting byte counts in decimal.
A first orientation search shows what is actually indexed:
index=* | stats count by index sourcetype
That returns IIS under web, Windows Security and Sysmon under wineventlog and sysmon, and a
family of Zeek sourcetypes (zeek:conn, zeek:http, zeek:rdp and more) under network. Sysmon is
the bulk of the volume, but this incident lives in the web, Windows, and Zeek data.
Task 2, part 1: the web request that started it
The first two questions anchor the timeline. Filtering the IIS logs to POST requests returns exactly one unusual entry.
  index=web sourcetype=iis cs_method=POST cs_uri_stem="/portal/status.aspx"
  | table _time, c_ip, s_ip, cs_method, cs_uri_stem, sc_status

The suspicious URI path is /portal/status.aspx, submitted at 09:16:31 UTC. The source IP that sent it is 10.81.73.36, and it hit the web server at 10.81.70.212 (AUR-WEB01). Those two values, the path and the source IP, are the pivots for everything that follows.
Task 2, part 2: the batch logon on the web server
Next, correlate that request with Windows logons on AUR-WEB01. A batch logon is Event ID 4624 with logon type 4, so filtering for it shows which account was running under the web application.
  index=wineventlog EventCode=4624 LogonType=4 TargetUserName="svc-webapp"
  | table _time, host, TargetUserName, LogonType, SubjectUserName
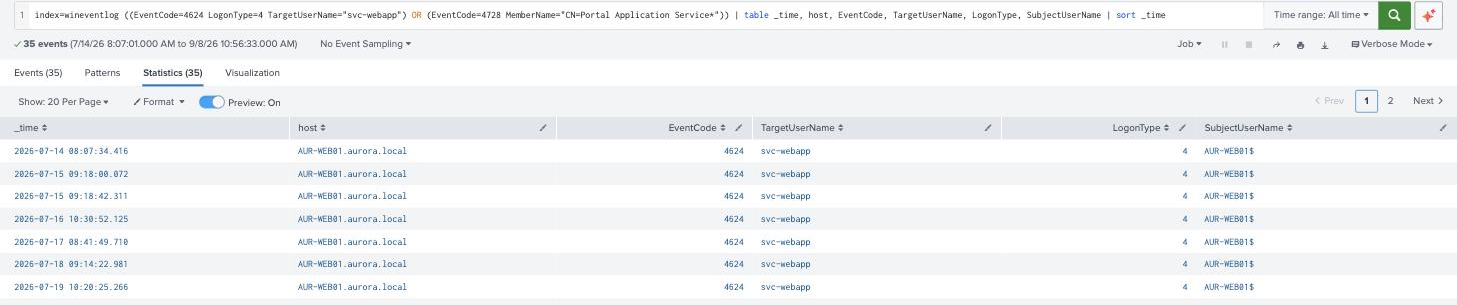
The non-system account is svc-webapp, the Portal Application Service account, and the recorded logon type is 4 (batch). The daily rows show this is normal baseline behaviour for the account, which is exactly why abusing a trusted service account is effective: the logons blend in.
Task 2, part 3: the privilege escalation
After the web activity, the account’s group membership changes. Event ID 4728 records a member added to a security-enabled global group, so filtering for the Portal Application Service account as the member surfaces the single escalation event.
  index=wineventlog EventCode=4728 MemberName="CN=Portal Application Service*"
  | table _time, host, TargetUserName, SubjectUserName, MemberName

Twelve seconds after the POST, at 09:16:43 on AUR-DC01, the service account is added to the
privileged group FS-Admins. The account that performed the change is a.ng. The TargetUserName
field on a 4728 event holds the group, and SubjectUserName holds the actor, which is the pair the
two questions ask for.
Task 2, part 4: the file-server logons
With new group rights, the account logs into the file server. Filtering 4624 events on AUR-FS01 for this account and listing the distinct logon types shows both a network logon and an interactive one.
  index=wineventlog EventCode=4624 host="AUR-FS01*"
  | stats values(LogonType) as types count by TargetUserName
The non-built-in account that produced both network and remote-interactive logons is again svc-webapp, carrying logon types 3, 4, and 10. The numeric logon type for a remote-interactive (RDP) session is 10. Seeing type 10 on a service account is the tell: service accounts should never be signing in interactively.
Task 2, part 5: the RDP connection and what left
The last pivot uses the original source IP, 10.81.73.36, to find the RDP activity in the incident
window. Zeek’s conn log stores the flow detail, so sorting the RDP flows by duration separates the
one real session from the noise.
  index=network sourcetype=zeek:conn src=10.81.73.36 dest_port=3389
  | table _time, src, dest, duration, orig_bytes, resp_bytes, conn_state
  | sort -duration

Most of the RDP flows are sub-millisecond resets (conn_state RSTO, zero bytes), which are the
immediately-reset probes. One flow stands out: a 17.5-second session to 10.81.112.251 that
actually transferred data. The resp_bytes value for that sustained connection is 181717, the
number of bytes the destination returned. That question accepts multiple formats, so the decimal byte
count is the safe answer per the room’s own guidance. That volume leaving over an interactive session
is the evidence of data being pulled back.
Two takeaways
First, a trusted service account is a blind spot precisely because its activity is normal. svc-webapp does batch logons every day, so the batch logon at 09:16 was invisible on its own. The signal was not any single event but the sequence: web request, then group change, then an interactive logon and an RDP transfer, all inside two minutes. Correlation across sources, not a single alert, is what makes the chain visible.
Second, read the field the source actually wrote, not the one your platform added. The room warns to
use source-specific host fields over Splunk’s ingestion host, and Zeek’s resp_bytes over a
derived total. Answering from the wrong field gives a plausible but wrong value, which is how these
investigations quietly go sideways.
Room solved 100%: 2 tasks, 11 answers.